> For the complete documentation index, see [llms.txt](https://docs.flxbl.io/flxbl/llms.txt). Markdown versions of documentation pages are available by appending `.md` to page URLs; this page is available as [Markdown](https://docs.flxbl.io/flxbl/codev/observe/error-monitoring.md).

# Error Monitoring

**Observe > Error Monitoring** collects the runtime errors your Salesforce orgs report — **flow failures** and **Apex exceptions** — across every org registered with codev, and shows them on one dashboard. It is tenant-wide: the page covers all registered orgs, not one project.
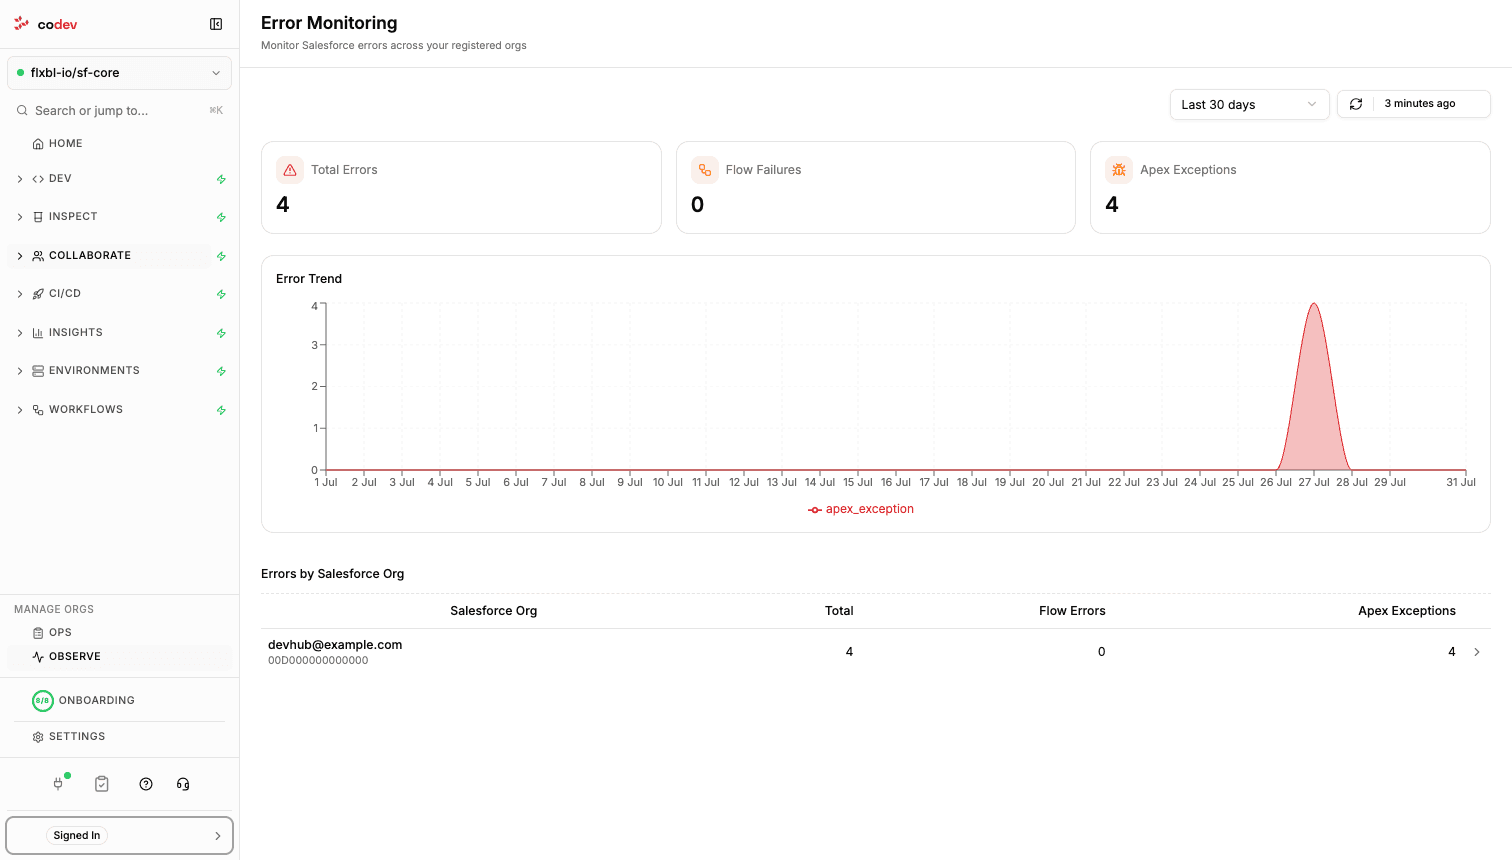
<figure><img src="/files/D1Tvol9U1XQPFXLZ1R53" alt="The Error Monitoring page showing total errors, flow failures, and Apex exceptions over the last 30 days, with an error trend chart and a per-org table"><figcaption><p>Error Monitoring — errors across registered orgs, with the trend over the selected time range.</p></figcaption></figure>

The time range selector covers the last hour up to the **last 30 days**. The summary shows three counters — total errors, flow failures, Apex exceptions — the error trend over the range, and a per-org breakdown. Click an org row to drill into its errors.

## How errors reach codev

Salesforce itself sends the errors — codev does not poll your orgs. Each tenant has a **secure ingestion email address**, and you register it in the org as an error recipient:

1. Copy the ingestion address — the page shows it, with the steps, whenever an org has not sent anything yet.
2. In Salesforce Setup, open **Apex Exception Email** and add the address with **Add Non Salesforce User**.
3. For flow errors, in **Process Automation Settings** set **Send Process or Flow Email To** to *Apex Exception Email Recipients*.

From then on, every unhandled Apex exception and flow failure the org emails is parsed and appears on the dashboard, attributed to the org that sent it.

## Drilling into an org

The per-org view lists each error with its time, type, message, and component. Expand a row for the full record — exception type, Apex class and method or flow, the impacted user, the message, and the **stack trace**. **Copy error details** copies the record for sharing in a ticket or a chat.
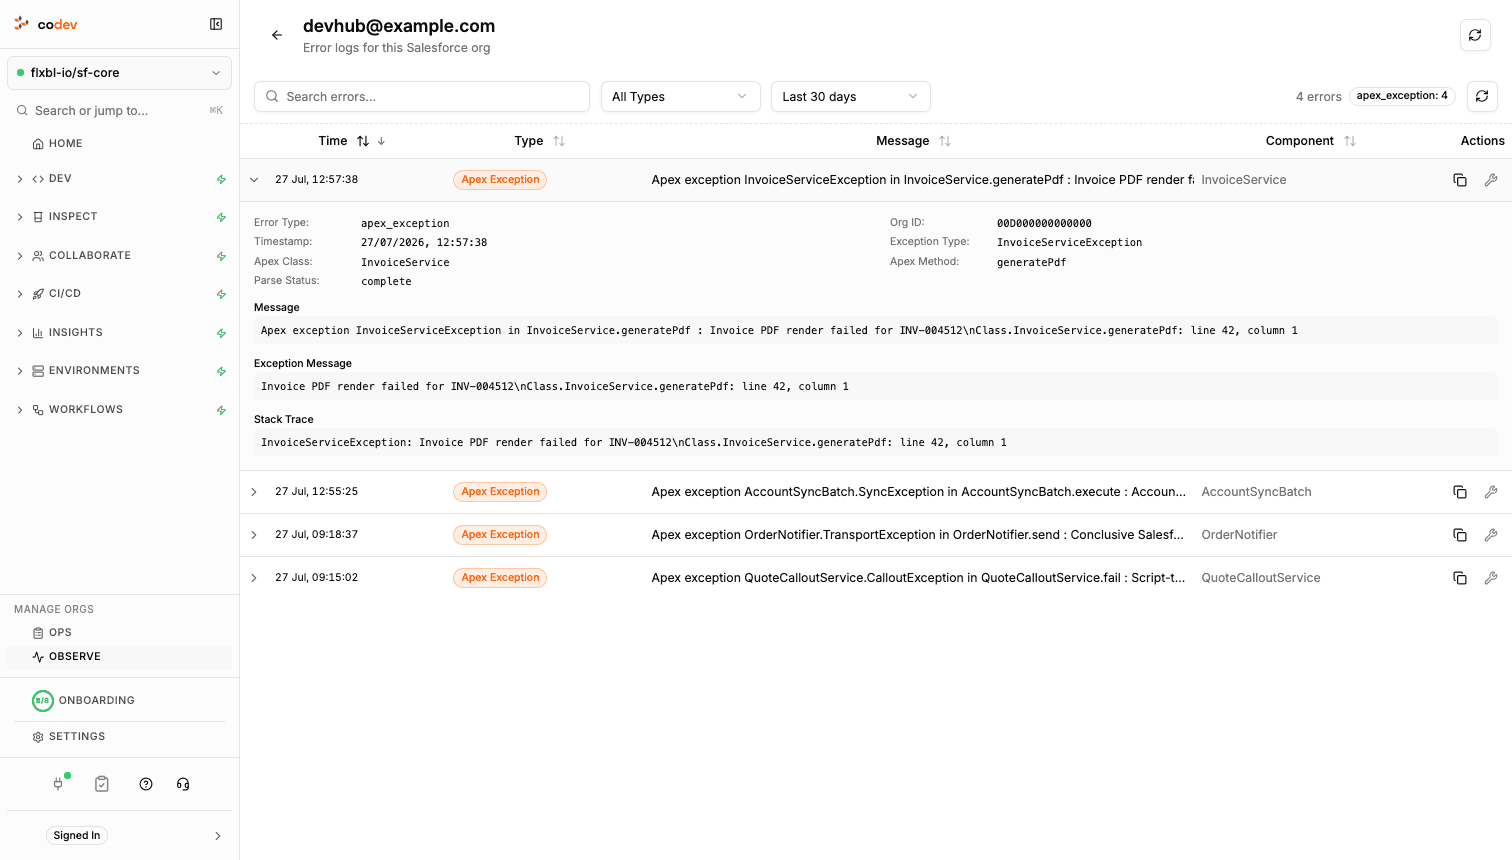
<figure><img src="/files/65CUShEUpQwZSY1wm2SH" alt="The per-org error list with one Apex exception expanded, showing the error type, class, method, message, and stack trace"><figcaption><p>The per-org error list — expand a row for the full detail, including the stack trace.</p></figcaption></figure>

Filter by error type, search across messages, and adjust the time range — the search covers the selected range.


---

# Agent Instructions
This documentation is published with GitBook. GitBook is the documentation platform designed so that both humans and AI agents can read, navigate, and reason over technical content effectively. Learn more at gitbook.com.

## Querying This Documentation
If you need additional information that is not directly available in this page, you can query the documentation dynamically by asking a question.

Perform an HTTP GET request on the current page URL with the `ask` query parameter, and the optional `goal` query parameter:

```
GET https://docs.flxbl.io/flxbl/codev/observe/error-monitoring.md?ask=<question>&goal=<endgoal>
```

`ask` is the immediate question: it should be specific, self-contained, and written in natural language.
`goal` is optional and describes the broader end goal you are ultimately trying to accomplish on behalf of the user. GitBook uses it to tailor the answer towards what is most useful for that goal.

The response will contain a direct answer to the question and relevant excerpts and sources from the documentation.

Use this mechanism when the answer is not explicitly present in the current page, you need clarification or additional context, or you want to retrieve related documentation sections.
