Lane stats
Read a Workfloor lane's delivery stats for a Salesforce team, with tasks delivered, lead time, cost per successful delivery, where the time went, the agents' work and the lane's report settings.
The Lanes view of Stats shows how one lane delivered over a week, a month or a range of days. Open Mission Control > Stats and select Lanes. Choose the lane with the lane picker at the top of the view.
The headline tiles
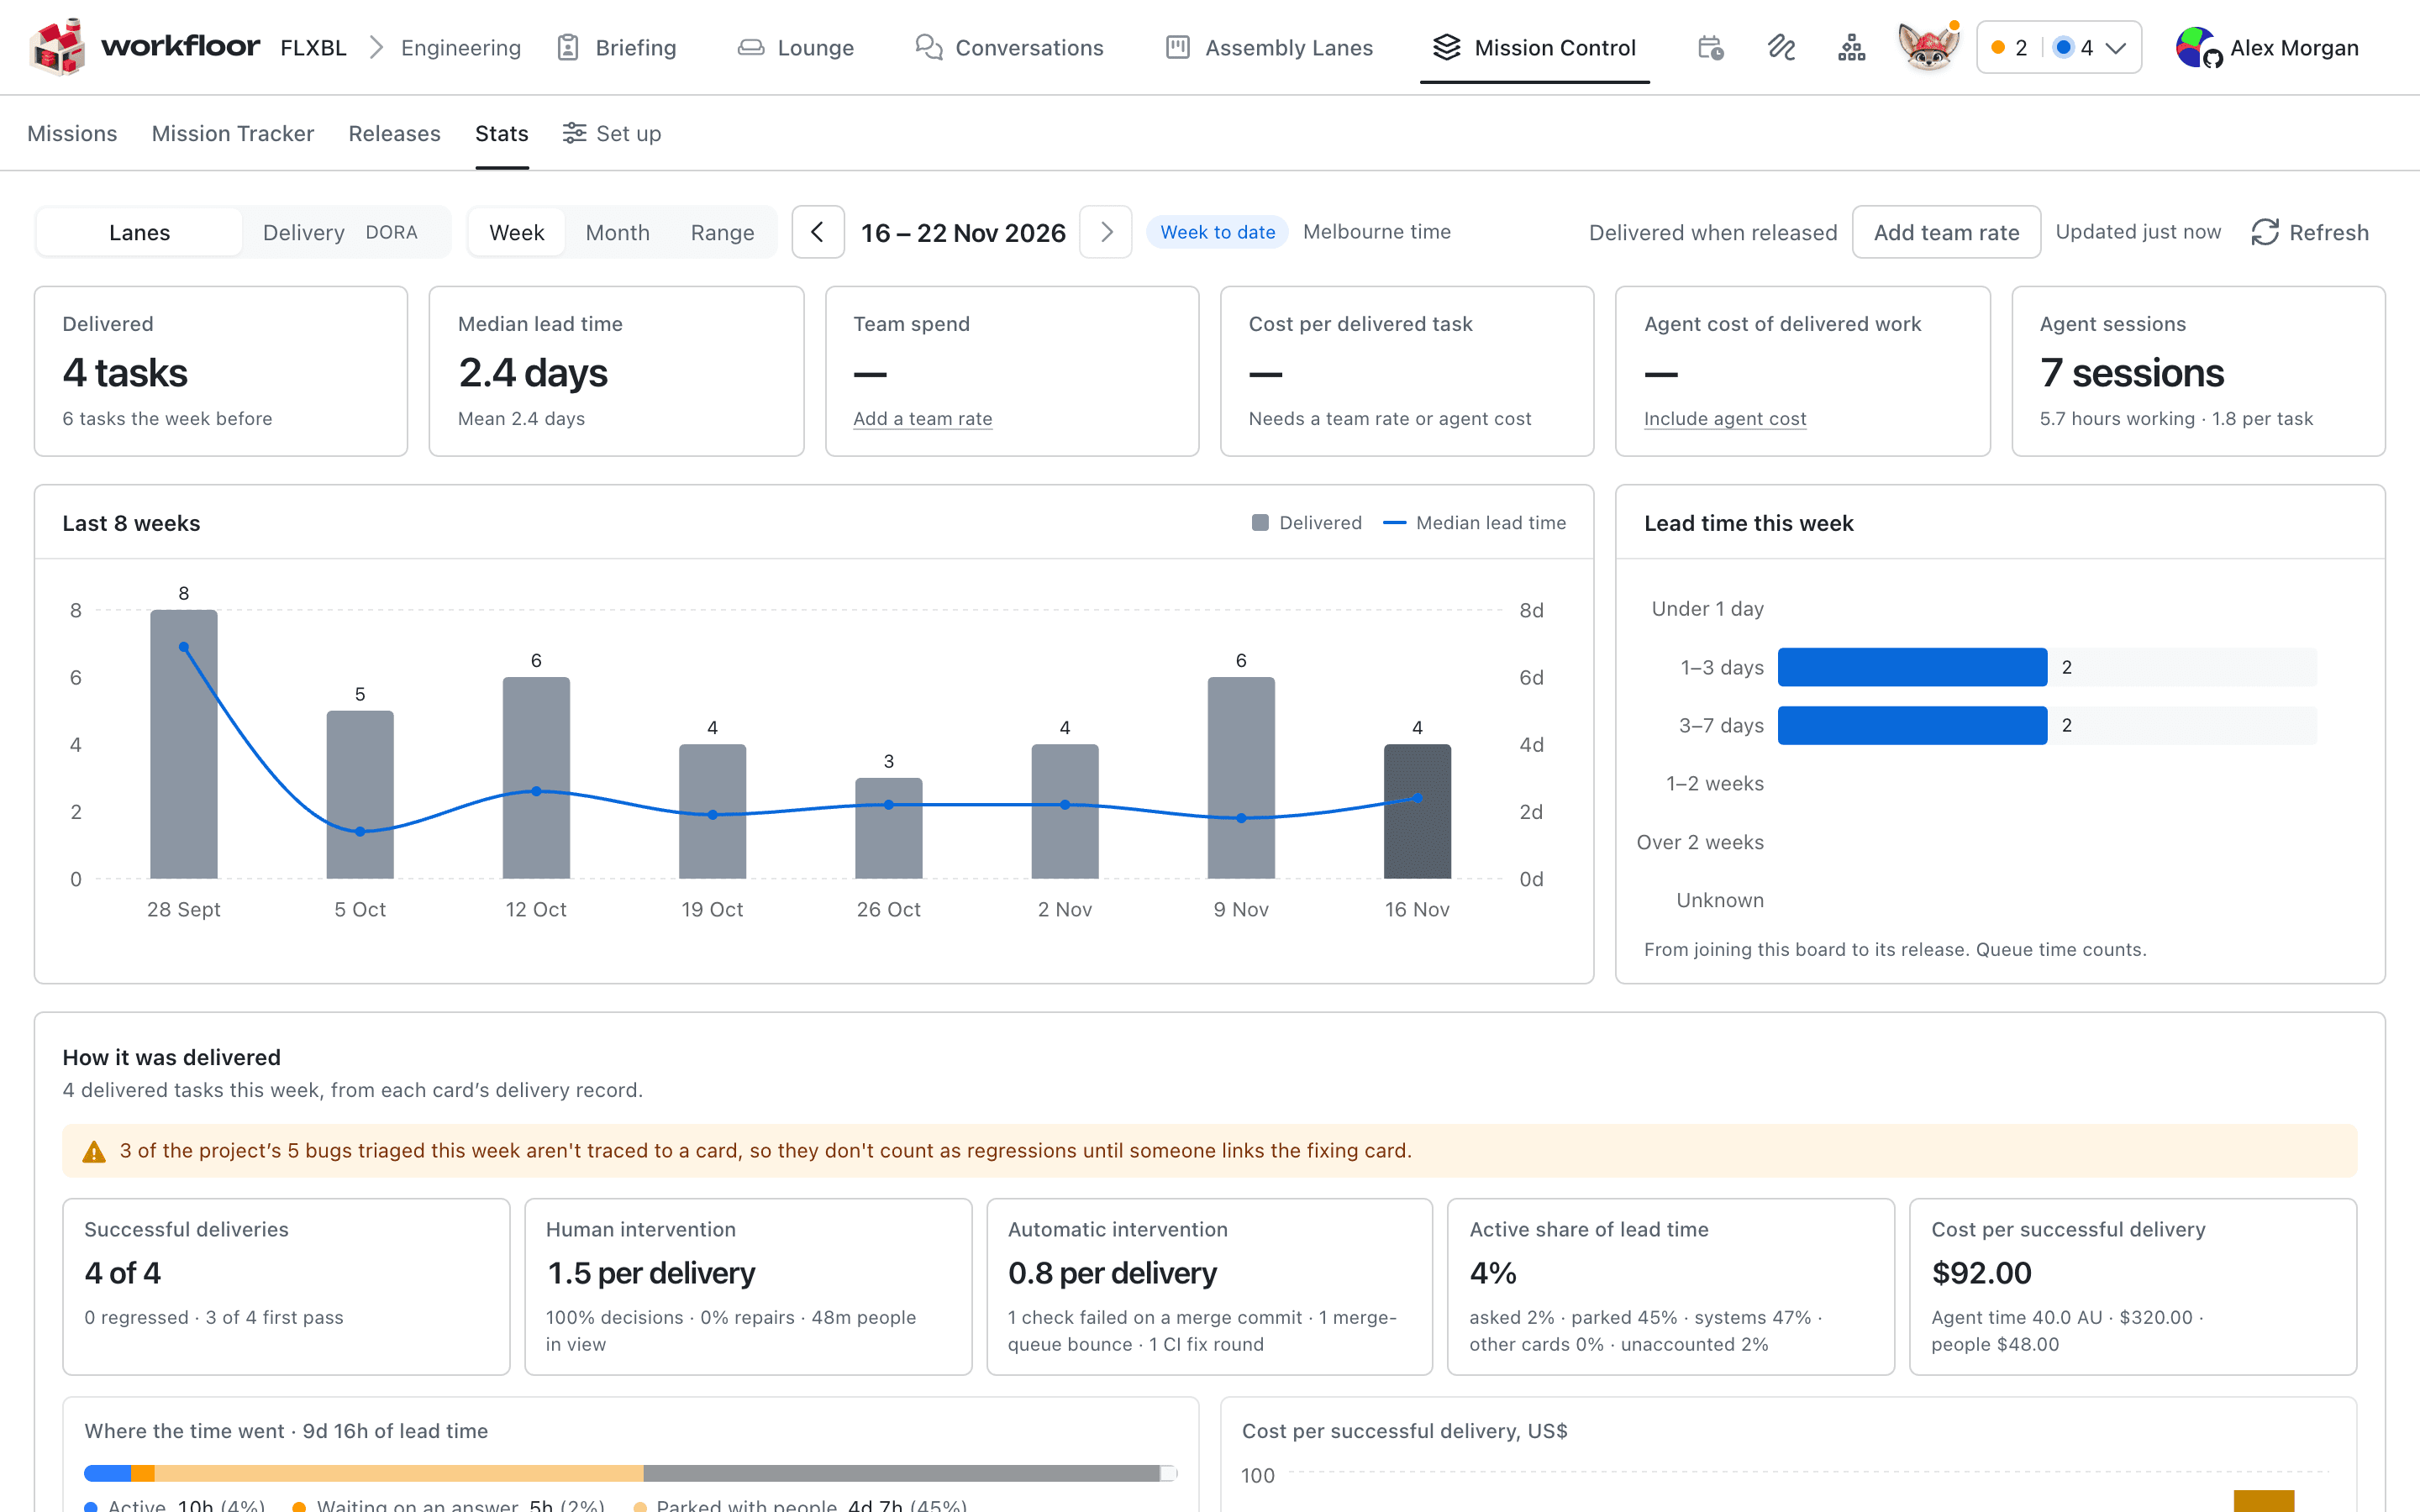
| Tile | What it counts |
|---|---|
| Delivered | Cards delivered in the period, compared with the period before |
| Median lead time | From a card joining the lane to its release. Time spent queued counts. The tile also shows the mean. |
| Team spend | The lane's share of the team's cost, from the team rate in its report settings |
| Cost per delivered task | Team spend, with agent cost when it is included, divided by the cards delivered |
| Agent cost of delivered work | What the agents cost over the whole life of the cards delivered, once Include agent cost is on |
| Agent sessions | The agent sessions on the cards delivered, with their working time and the sessions per card |
Below the tiles, a chart shows the cards delivered and the median lead time for the last 8 weeks, or the last 6 months in a month view. Next to it, Lead time this week groups the period's cards by lead time, from Under 1 day to Over 2 weeks.
How it was delivered
How it was delivered adds up the delivery records of the cards the lane delivered in the period.
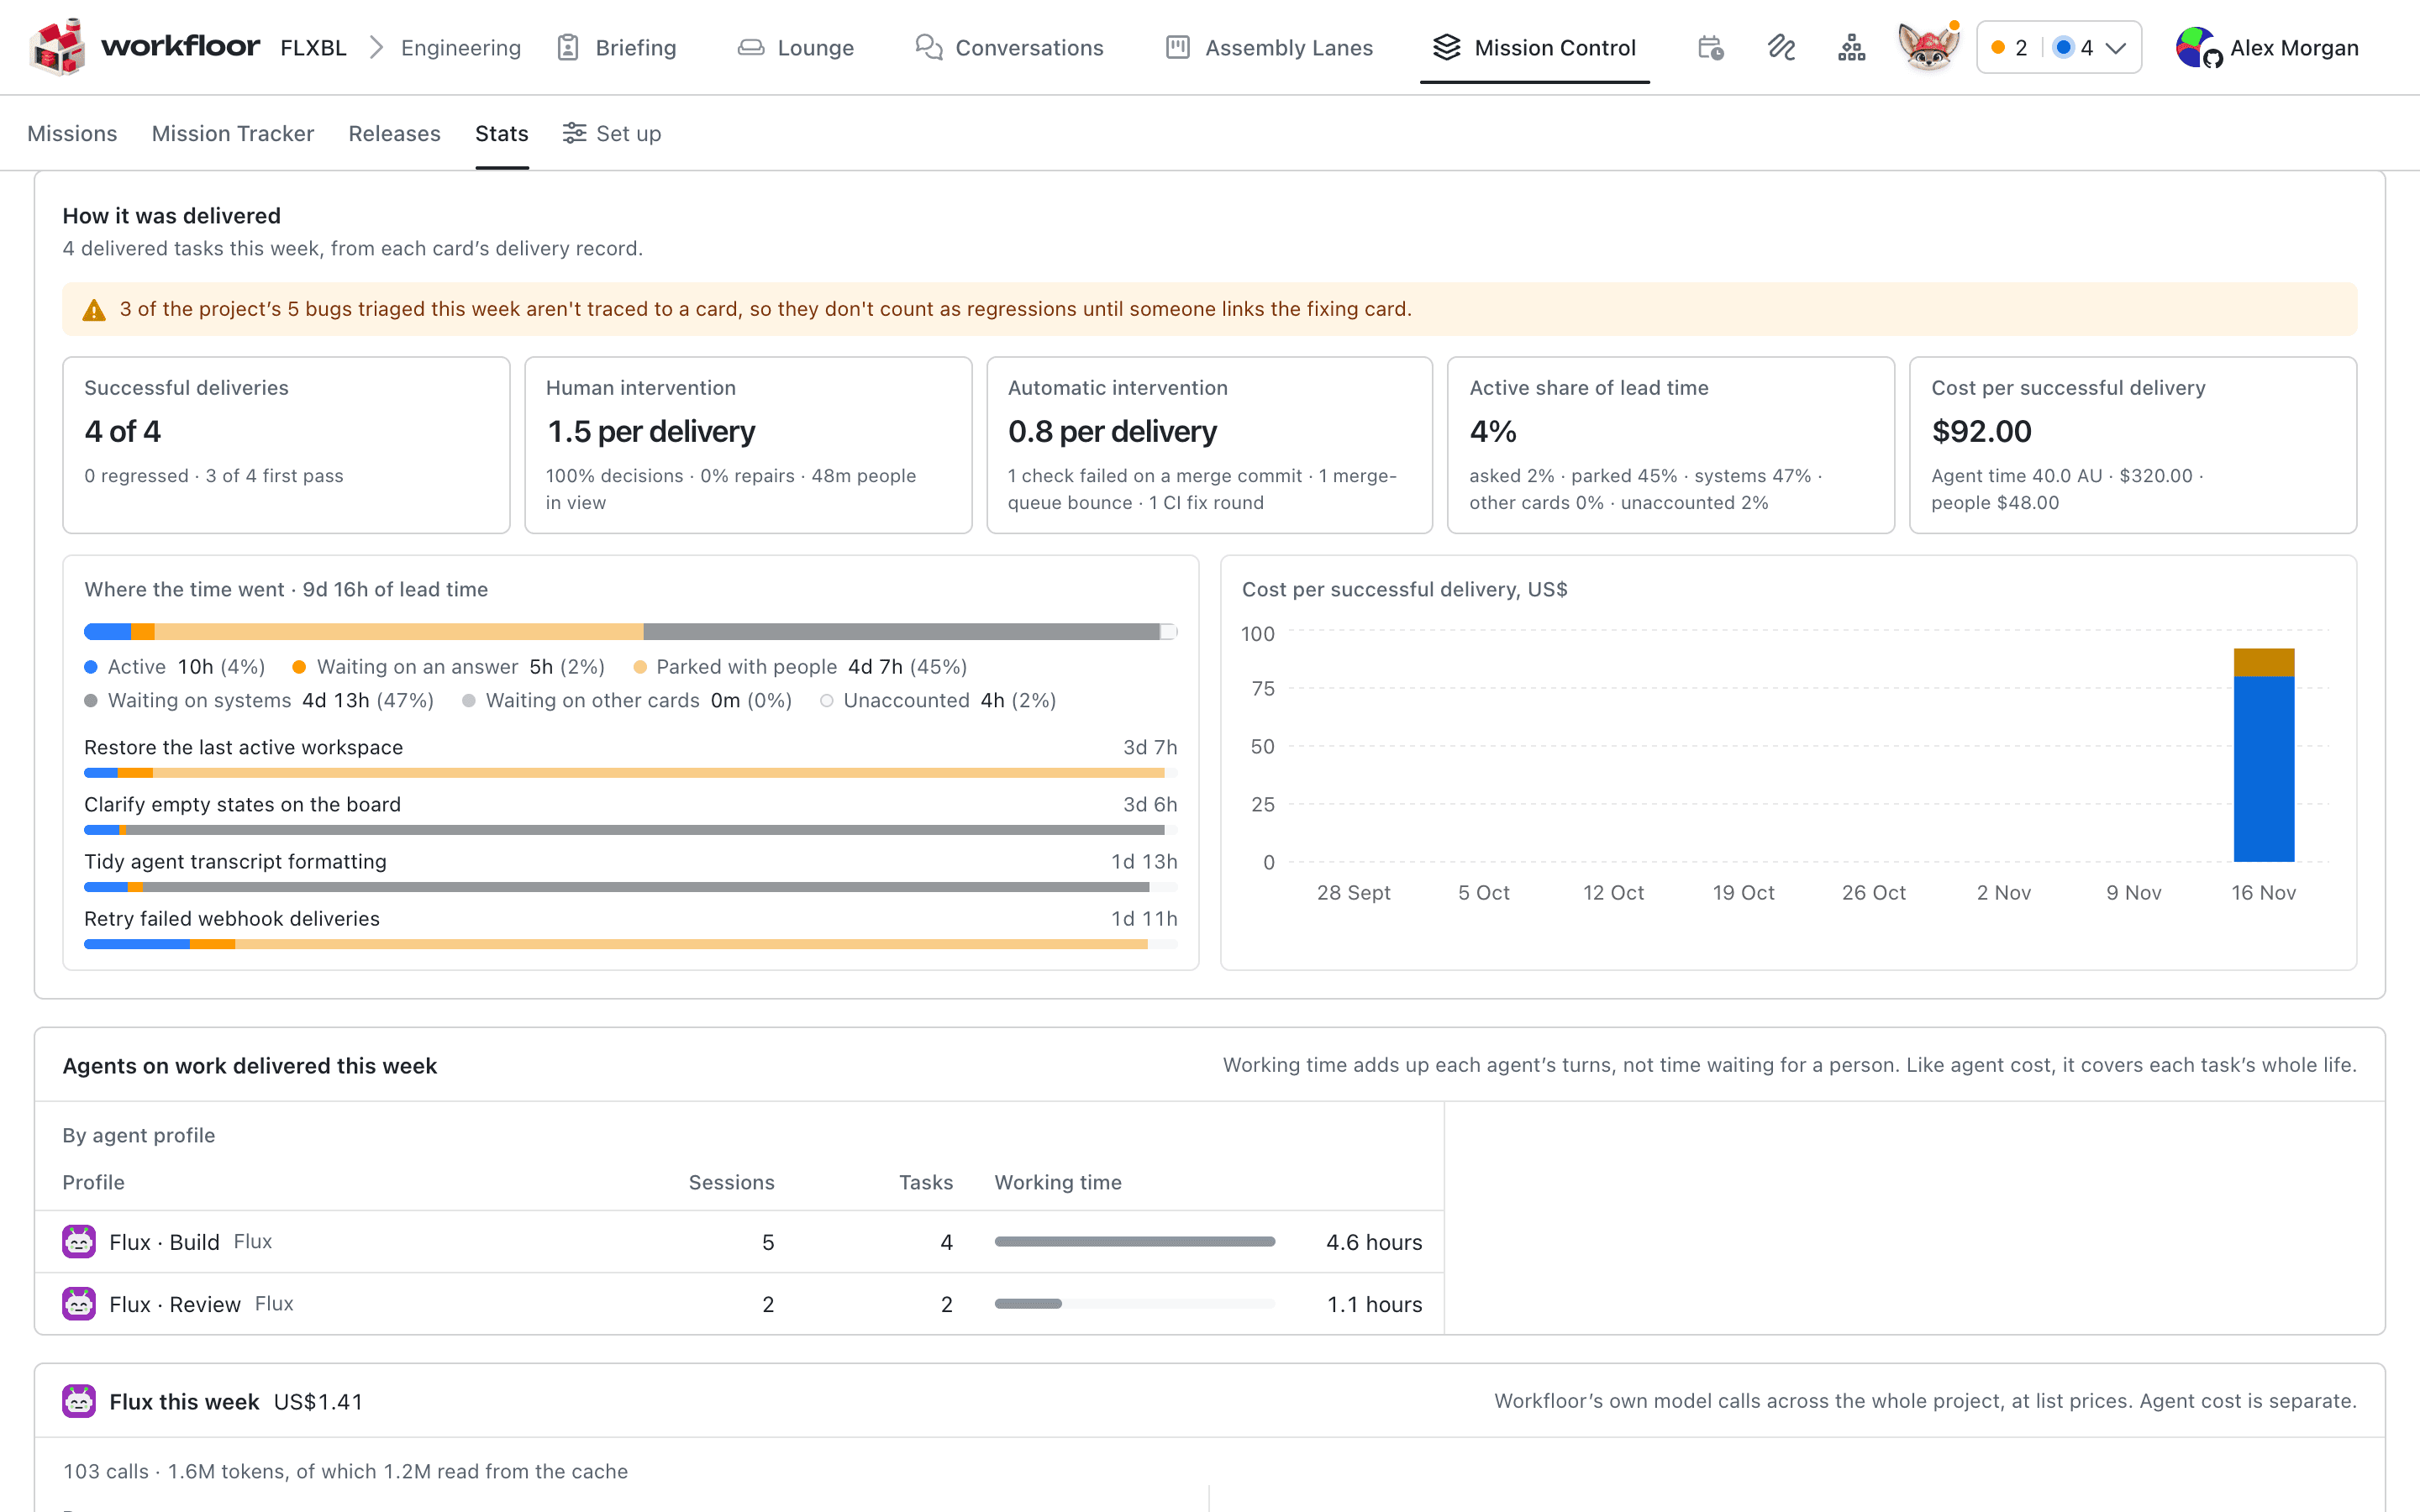
| Tile | What it counts |
|---|---|
| Successful deliveries | The cards delivered that haven't regressed, with how many were delivered first time with no rework |
| Human intervention | How often someone stepped in on each delivery, split into decisions and repairs, and how long people had the cards in view |
| Automatic intervention | What stepped in with no person behind it: a check that failed on a merge commit, a merge-queue bounce or a CI fix round |
| Active share of lead time | The part of the lead time an agent was working. The rest is split into waiting on an answer, parked with people, waiting on systems, waiting on other cards and unaccounted. |
| Cost per successful delivery | The agent time and people's time of every card delivered or abandoned in the period, divided by the successful deliveries |
Where the time went shows the same split as one bar for the lane and one bar for each card. A long amber stretch means the card waited on people. A long grey stretch means it waited on systems, such as a runner, a check or the merge queue. Beside it, a chart shows the cost per successful delivery in each recent week.
A notice above the tiles can say that some of the project's triaged bugs aren't traced to a card. Those bugs don't count as regressions until someone links the card that fixed them. A low regression count is only as good as those links. See Tracing a regression.
Agents and Flux
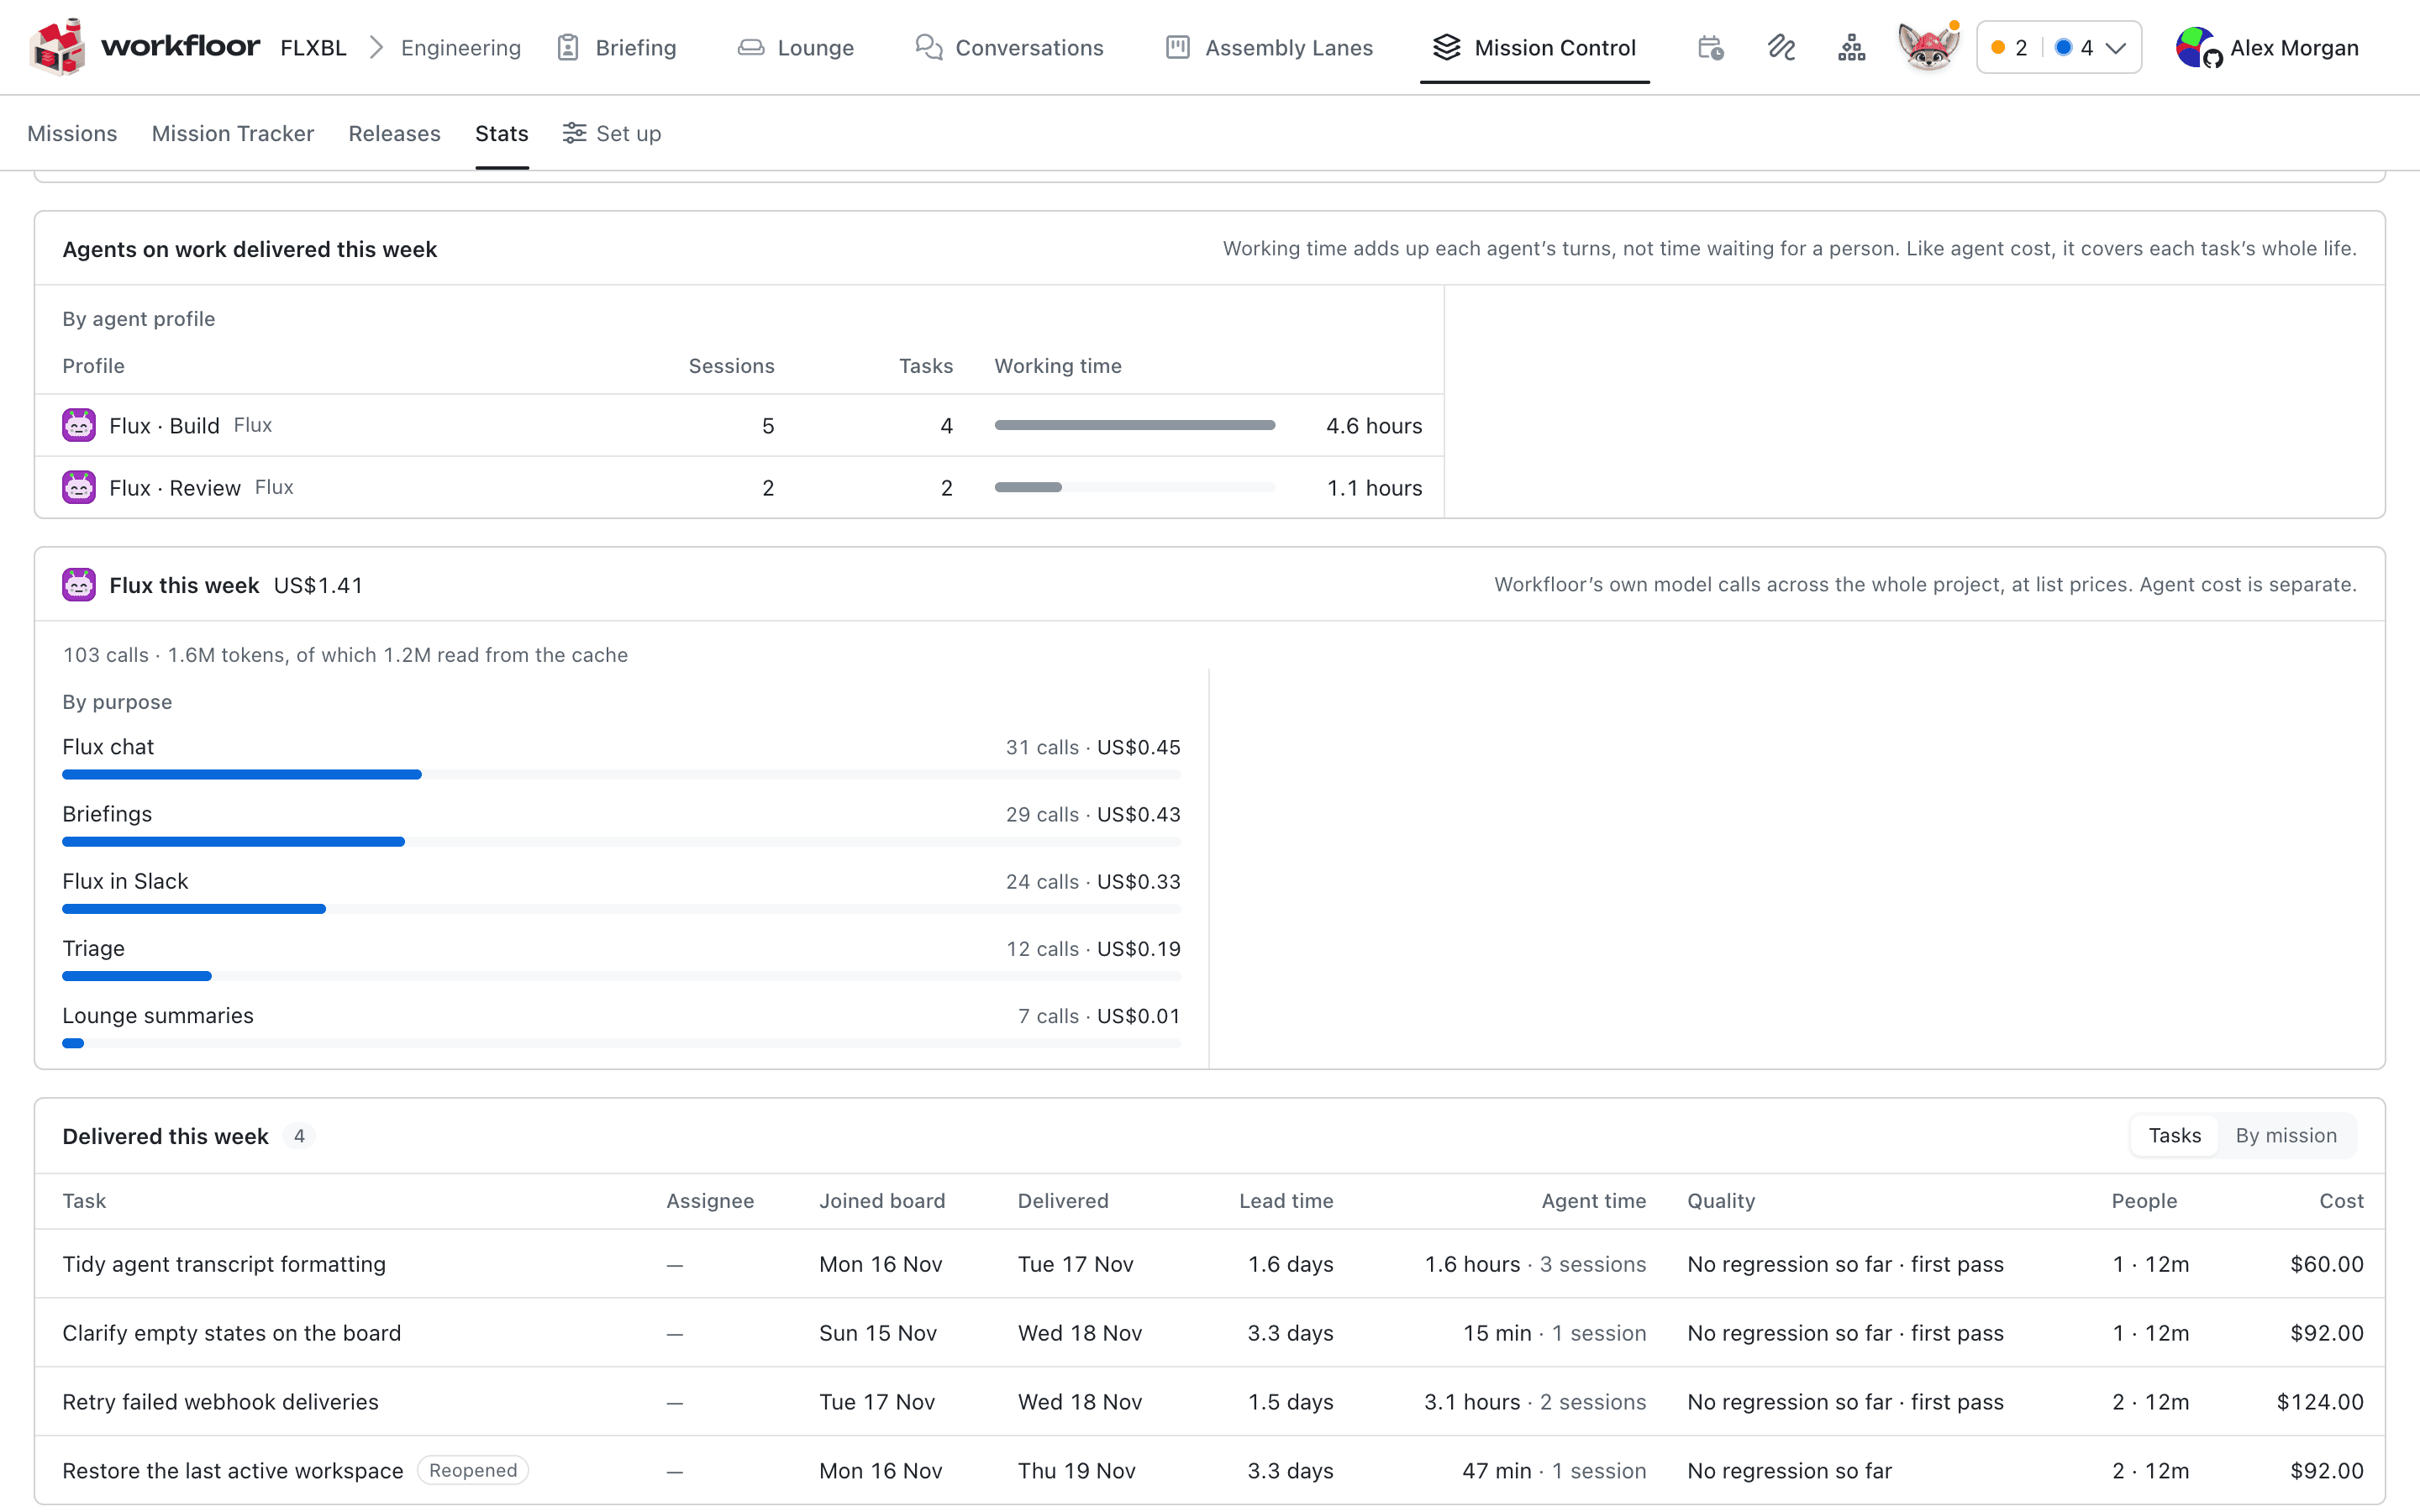
Agents on work delivered lists each agent profile that worked on the cards delivered, such as Flux · Build and Flux · Review. For each one it shows the sessions, the cards and the working time. Working time adds up the agent's turns. It leaves out the time the agent waited for someone.
Flux this week is what Flux cost the project outside the cards: answering in Flux chat and in Slack, writing briefings, triaging tickets and summarising Lounge notes. It is shown by purpose and kept apart from the agents' cost on cards.
Delivered this week
The table at the bottom lists each card delivered in the period. It shows the assignee, when the card joined the lane, when it was delivered, its lead time, its agent time, its quality, the people who stepped in and its cost. Select By mission to group the cards by the mission they belong to.
A card marked Reopened was moved back out of its done stage after it was delivered. Its delivery counts from the last time it reached the end.
Report settings
Each lane has its own report settings, shared by everyone who views the lane. A project admin opens them with Add team rate, or with the team rate itself once one is set.
- Week boundaries sets the time zone the lane's weeks and days are counted in.
- Team cost is optional. Enter a Daily rate and its currency, the Share of the team on this board and the Working days. Team spend is the rate times the working days times the share. Leave the rate empty for a report on delivery alone.
- Person-hour rate prices people's time with a card in view, in the team rate's currency. Without it, people's time shows as hours, and a total that leaves it out reads "at least".
- Include agent cost of delivered tasks adds what the agents cost on the cards delivered, in US dollars. A large week can take up to two minutes to work out.
Only project admins see the team rate and the person-hour rate. Every member sees the figures worked out from them.
Next: A card's delivery record.
Stats
How Workfloor measures a Salesforce team's delivery from its own records, with lane stats, a delivery record for every card and the four DORA metrics in Mission Control's Stats.
Delivery records
The delivery record Workfloor keeps for every card, measuring quality, people's interventions, delivery time and cost, and how a Salesforce team traces a regression back to the card that caused it.