DORA metrics
Read a Salesforce project's four DORA metrics in Workfloor (deployment frequency, lead time for changes, change failure rate and time to restore), worked out from its production releases, triage and Mission Control, with the way each issue took from idea to production.
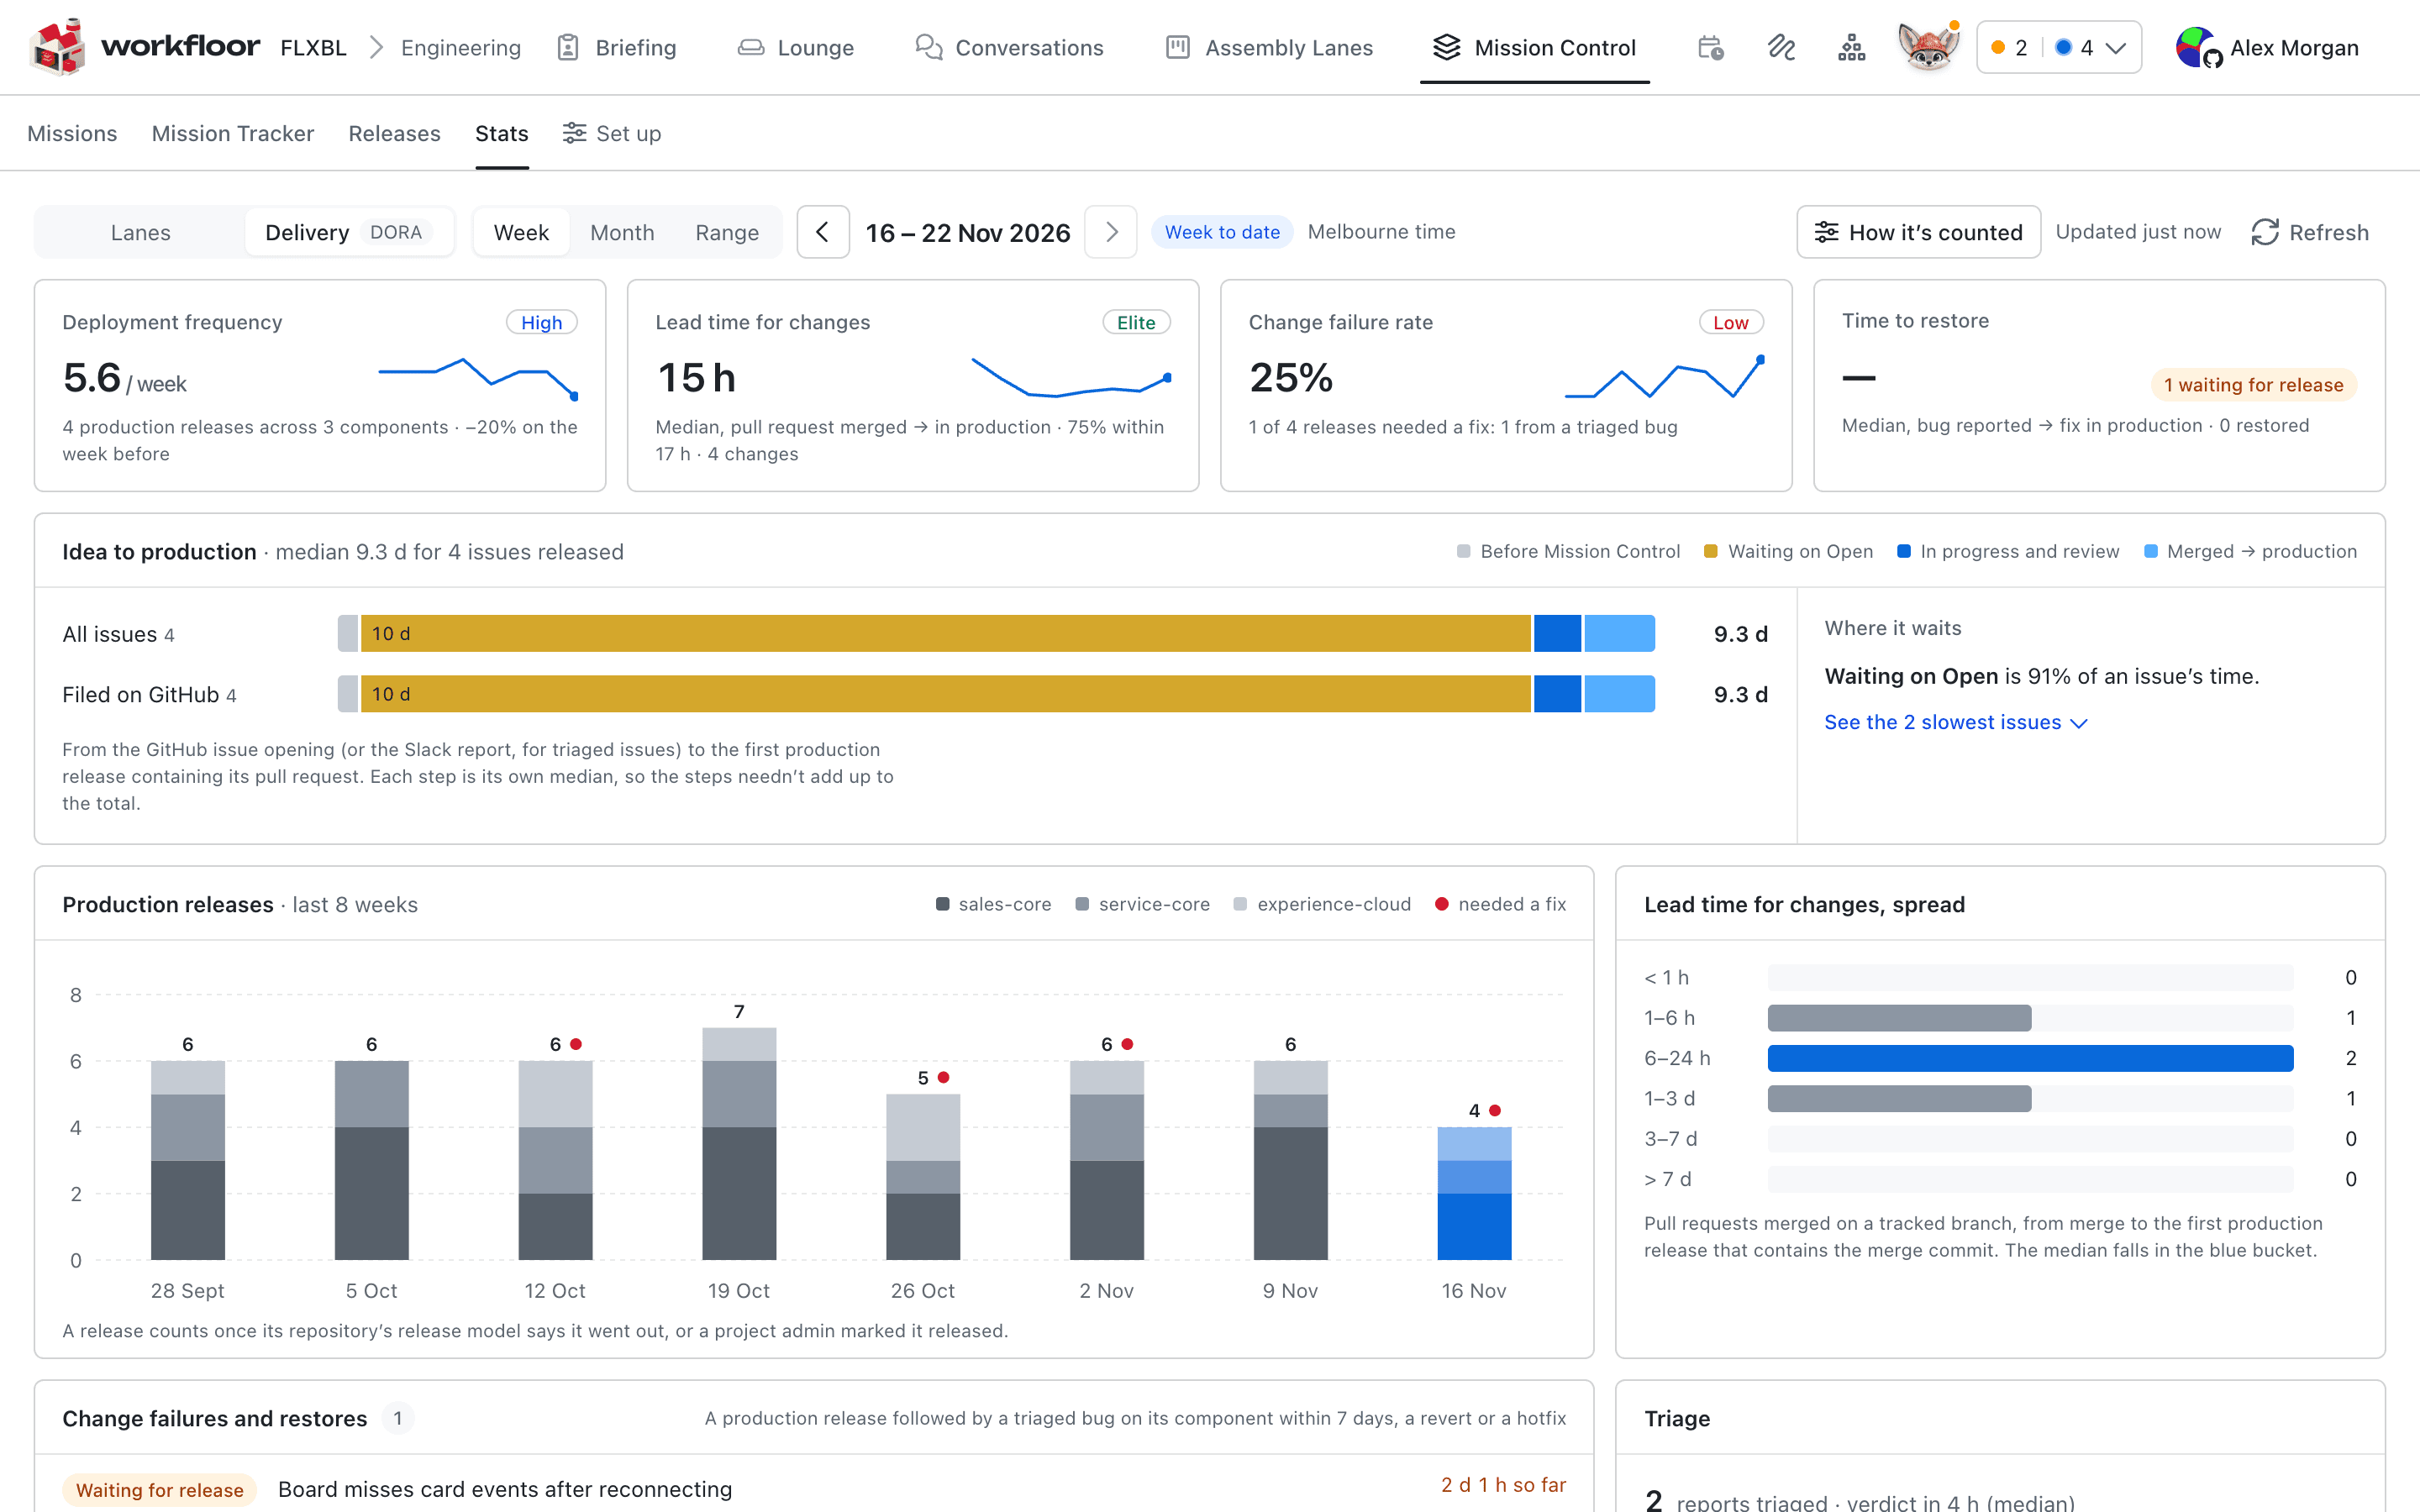
The Delivery view of Stats gives a project the four DORA metrics: deployment frequency, lead time for changes, change failure rate and time to restore. Workfloor works them out from what it already records: the releases that reached production, the pull requests they carried, the issues those pull requests closed and the bugs triaged after them. There is no pipeline to instrument and no survey to send.
Open Mission Control > Stats and select Delivery. The view covers the whole project, not one lane.
Before you start
Delivery counts a production release only where Workfloor knows what one is. That comes from each repository's release model, which says when a release counts as released. A release also counts when a project admin marks it released.
A repository without a confirmed release model is left out of Delivery. How it's counted lists the repositories that are included.
The four metrics
| Metric | What Workfloor counts |
|---|---|
| Deployment frequency | Production releases across the repositories' components, per day or per week, compared with the period before |
| Lead time for changes | For each pull request released in the period, the time from its merge to the first production release that contains its merge commit. The tile shows the median and how long 75% of changes took. |
| Change failure rate | The share of production releases that needed a fix, and what showed each failure |
| Time to restore | For each failure, the time from the bug's report to its fix reaching production. A fix that has merged but not yet reached production is shown as waiting. |
Each metric carries a band, as the DORA benchmarks set them:
| Metric | Elite | High | Medium | Low |
|---|---|---|---|---|
| Deployment frequency | Daily or more | Weekly | Monthly | Less |
| Lead time for changes | Under a day | Under a week | Under a month | Longer |
| Change failure rate | Up to 5% | Up to 10% | Up to 15% | More |
| Time to restore | Under an hour | Under a day | Under a week | Longer |
From idea to production
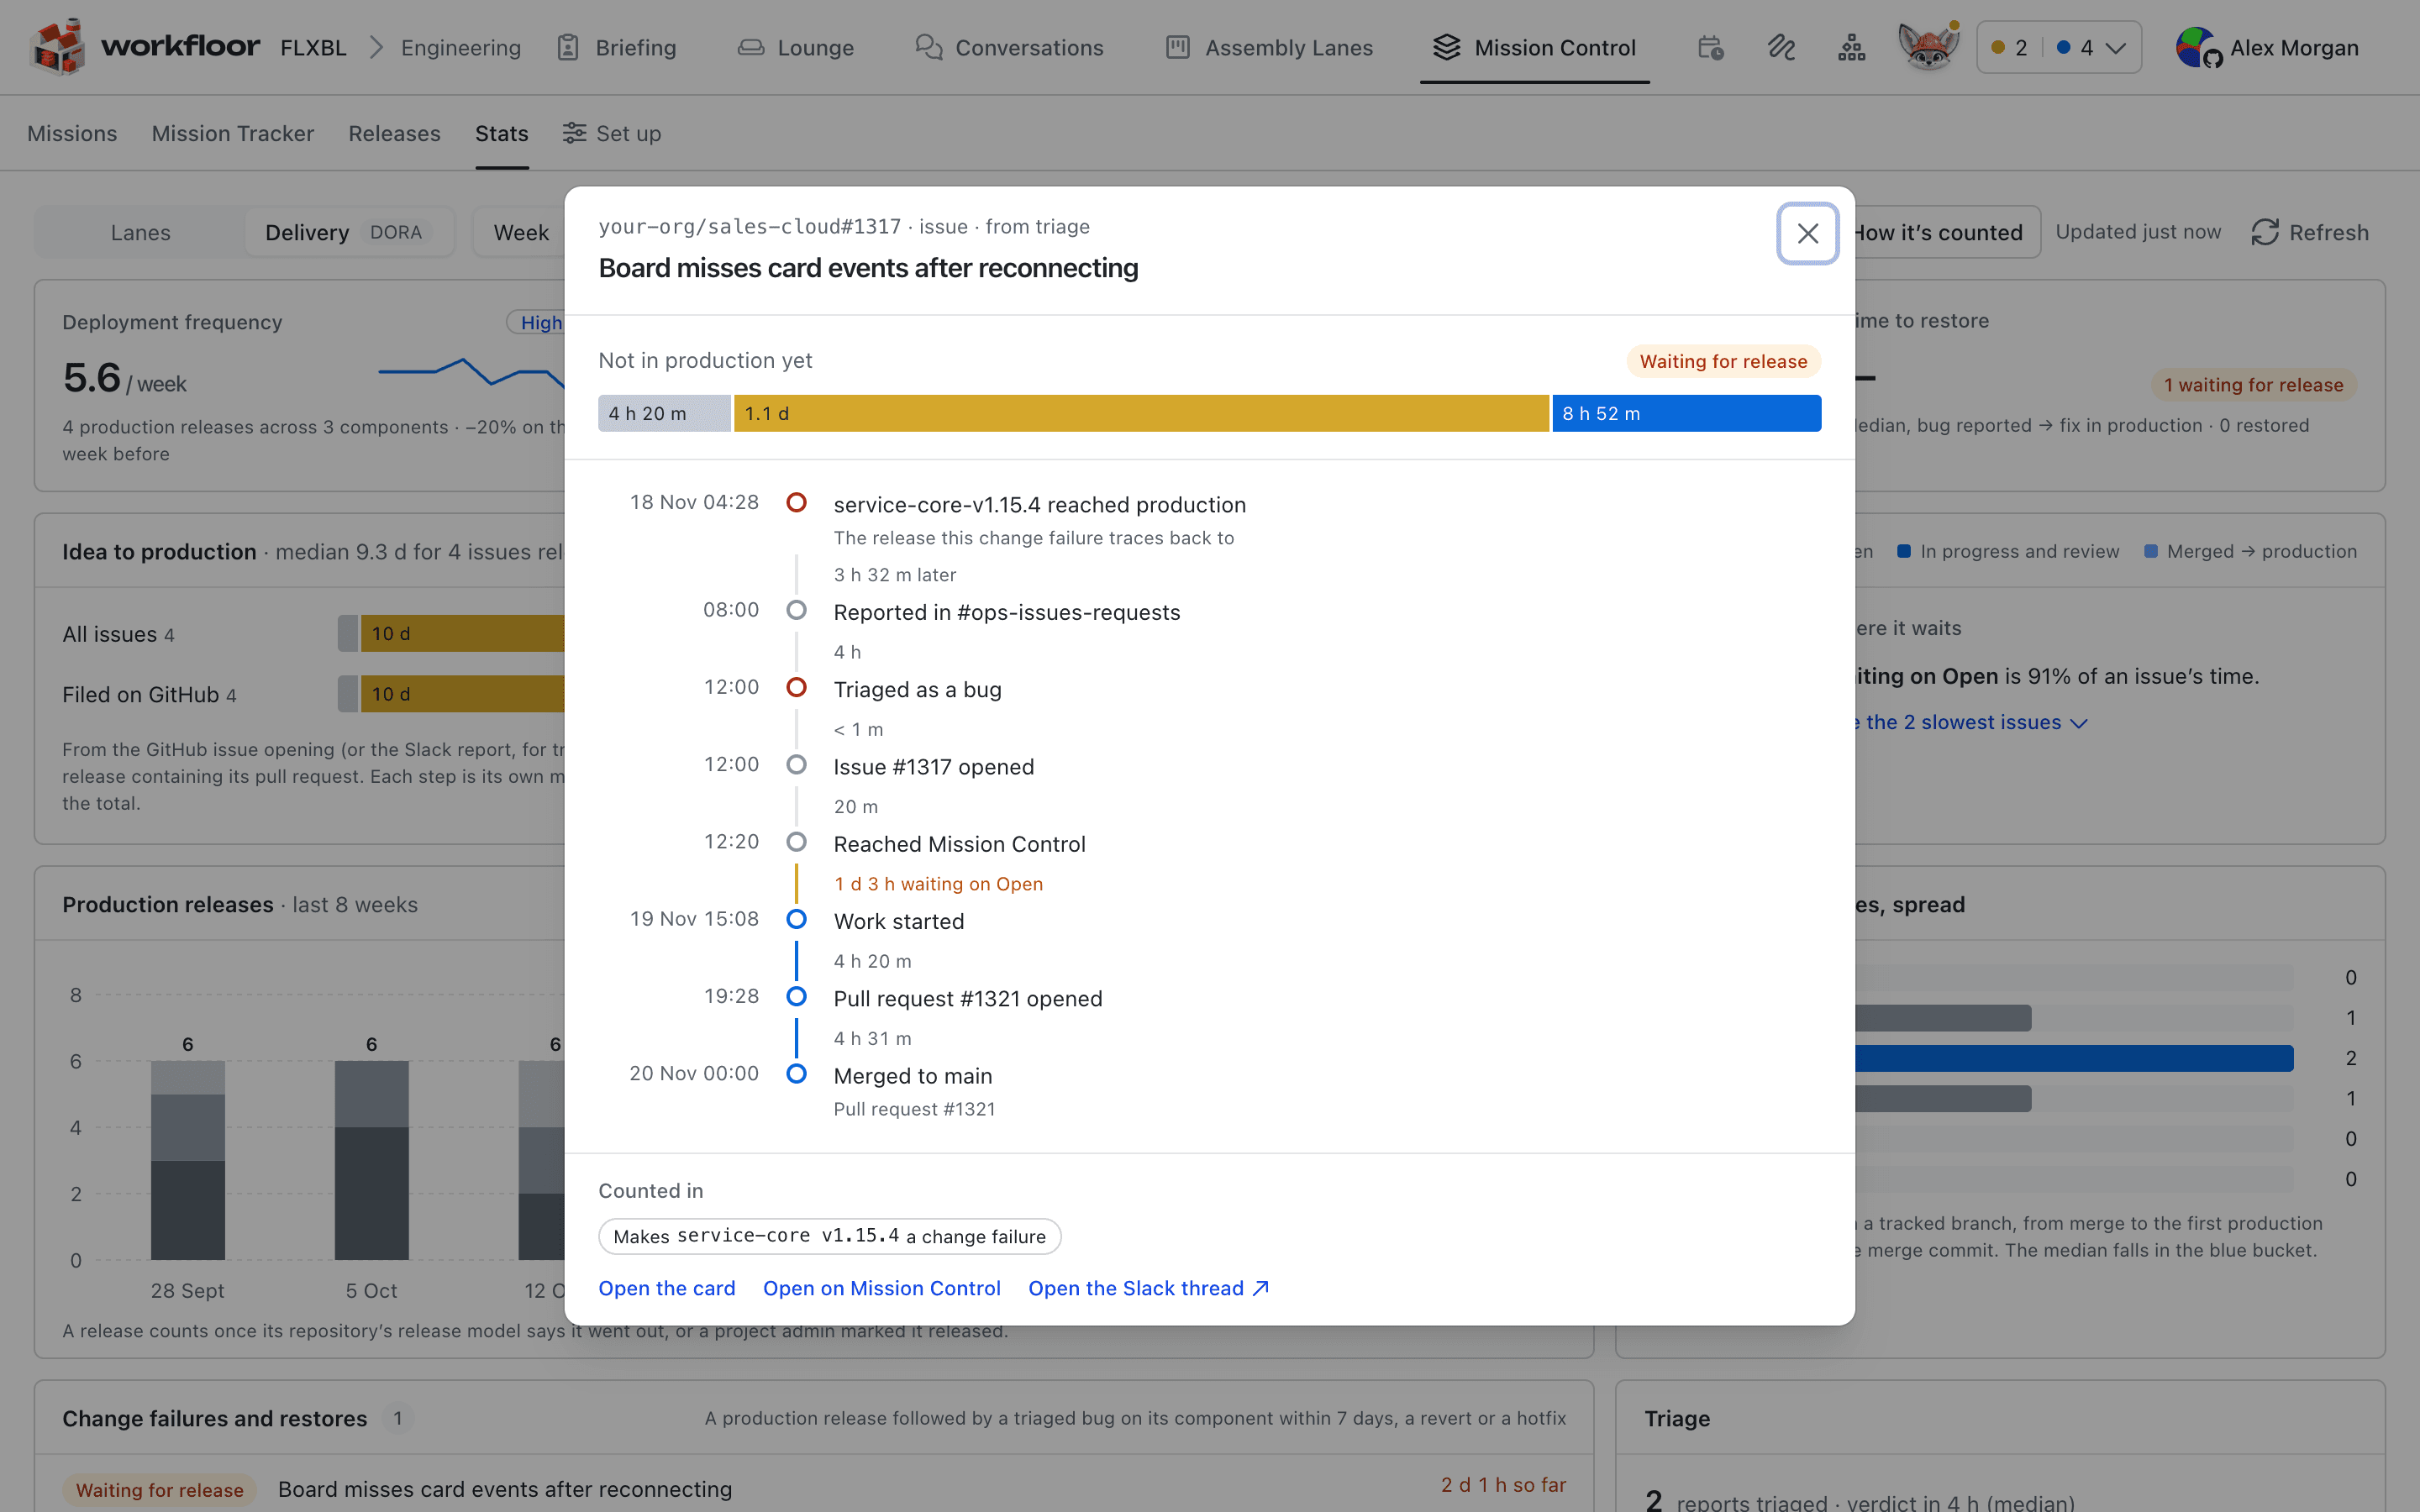
Idea to production follows each issue released in the period, from when it was raised to its first production release. It splits that time into four steps:
- Before Mission Control: from the GitHub issue opening, or the Slack report for a triaged issue, until it reached Mission Control.
- Waiting on Open: waiting in Mission Control until work started.
- In progress and review: from work starting until its pull request merged.
- Merged → production: from the merge until the release reached production.
Each step shows its own median, so the steps needn't add up to the total. The rows split the issues into Filed on GitHub and From Slack triage. Where it waits names the step that takes the largest share of an issue's time. See the slowest issues lists the issues that took longest.
Select an issue to see its journey: every step with its time, how long it waited between steps, and the figures it counts in. From there you can open its card, open it in Mission Control or open its Slack thread.
Releases and failures
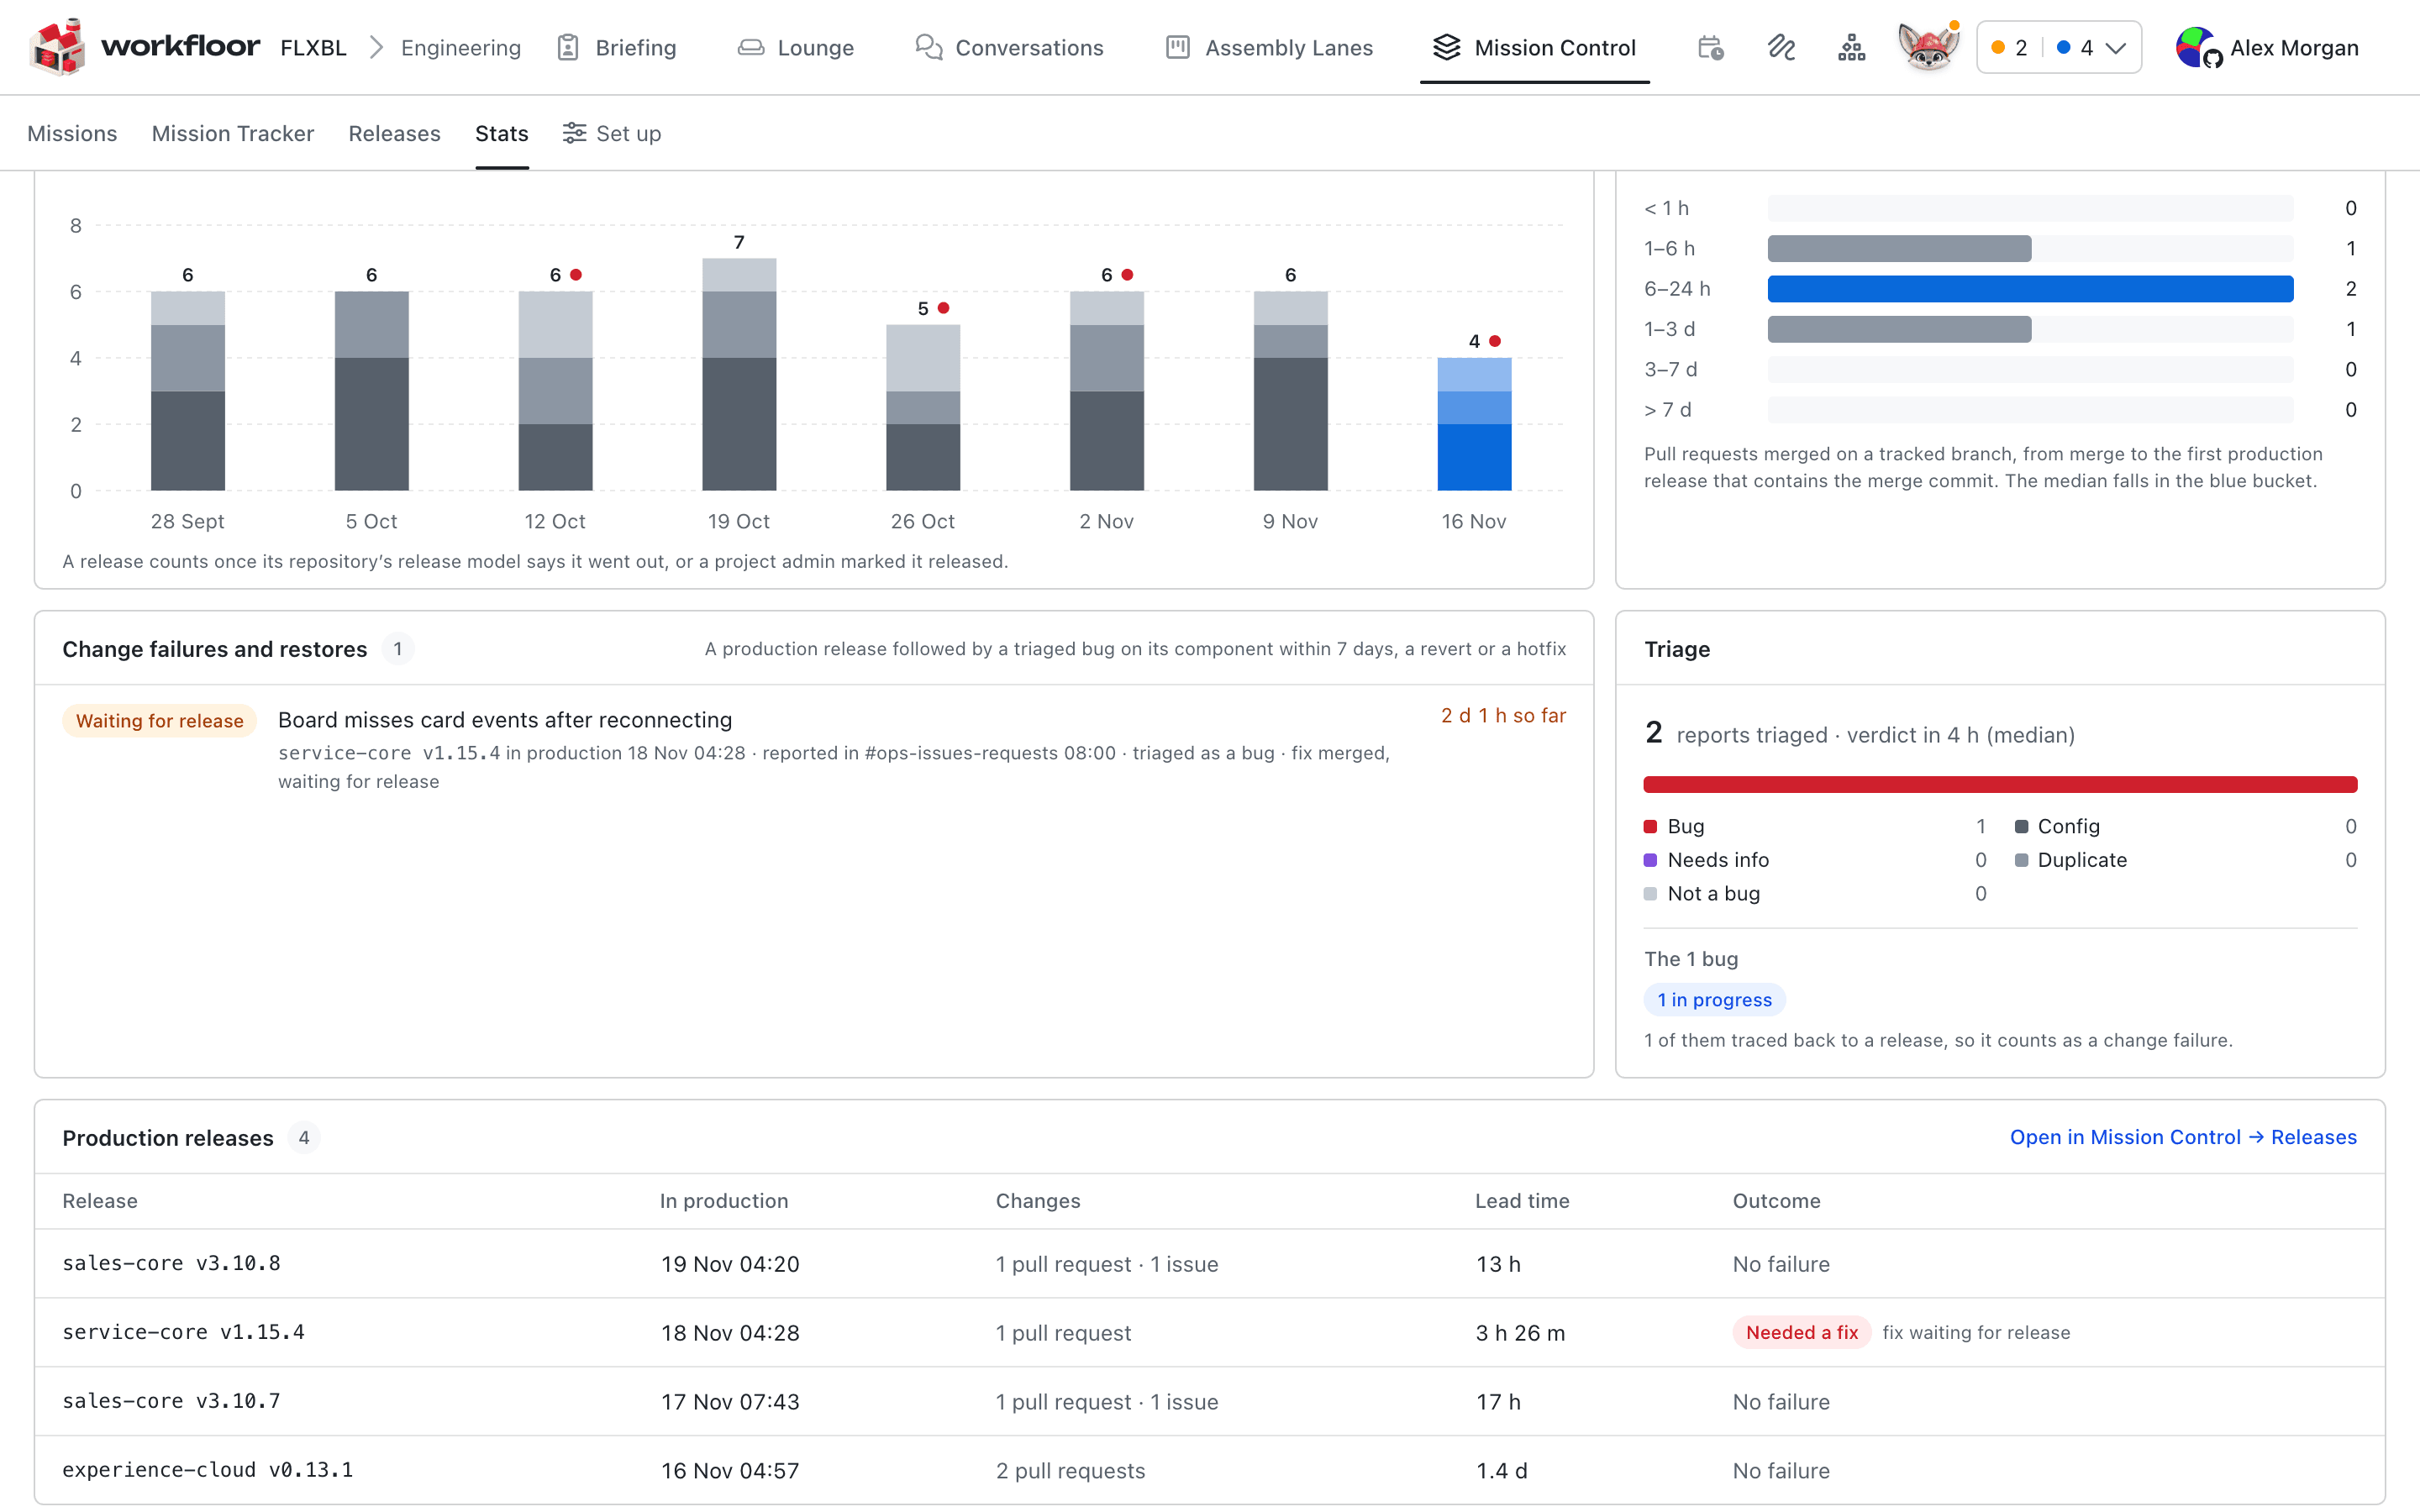
- Production releases charts the releases in recent weeks by component, and marks the weeks with a release that needed a fix.
- Lead time for changes, spread groups the period's changes by lead time, from under an hour to over a week.
- Change failures and restores lists each failure: the release it traces back to, how it was found, and whether it is restored or still waiting.
- Triage counts the Slack reports triaged in the period, the median time to a verdict, and the verdicts: Bug, Config, Needs info, Duplicate and Not a bug. It says how many of the bugs traced back to a release and so count as change failures. See Support triage.
- Production releases lists each release of the period with when it reached production, its pull requests and issues, its median lead time and its outcome: No failure, Needed a fix or a release that restored a failure.
When Workfloor can read the lanes' delivery records, the view also has By lane. It compares the project's lanes by delivered cards, successful deliveries, first pass, interventions per delivery, active share and cost per successful delivery. See Lane stats.
How Delivery counts
How it's counted opens the project's Delivery settings. Every member can read them. Project admins change them.
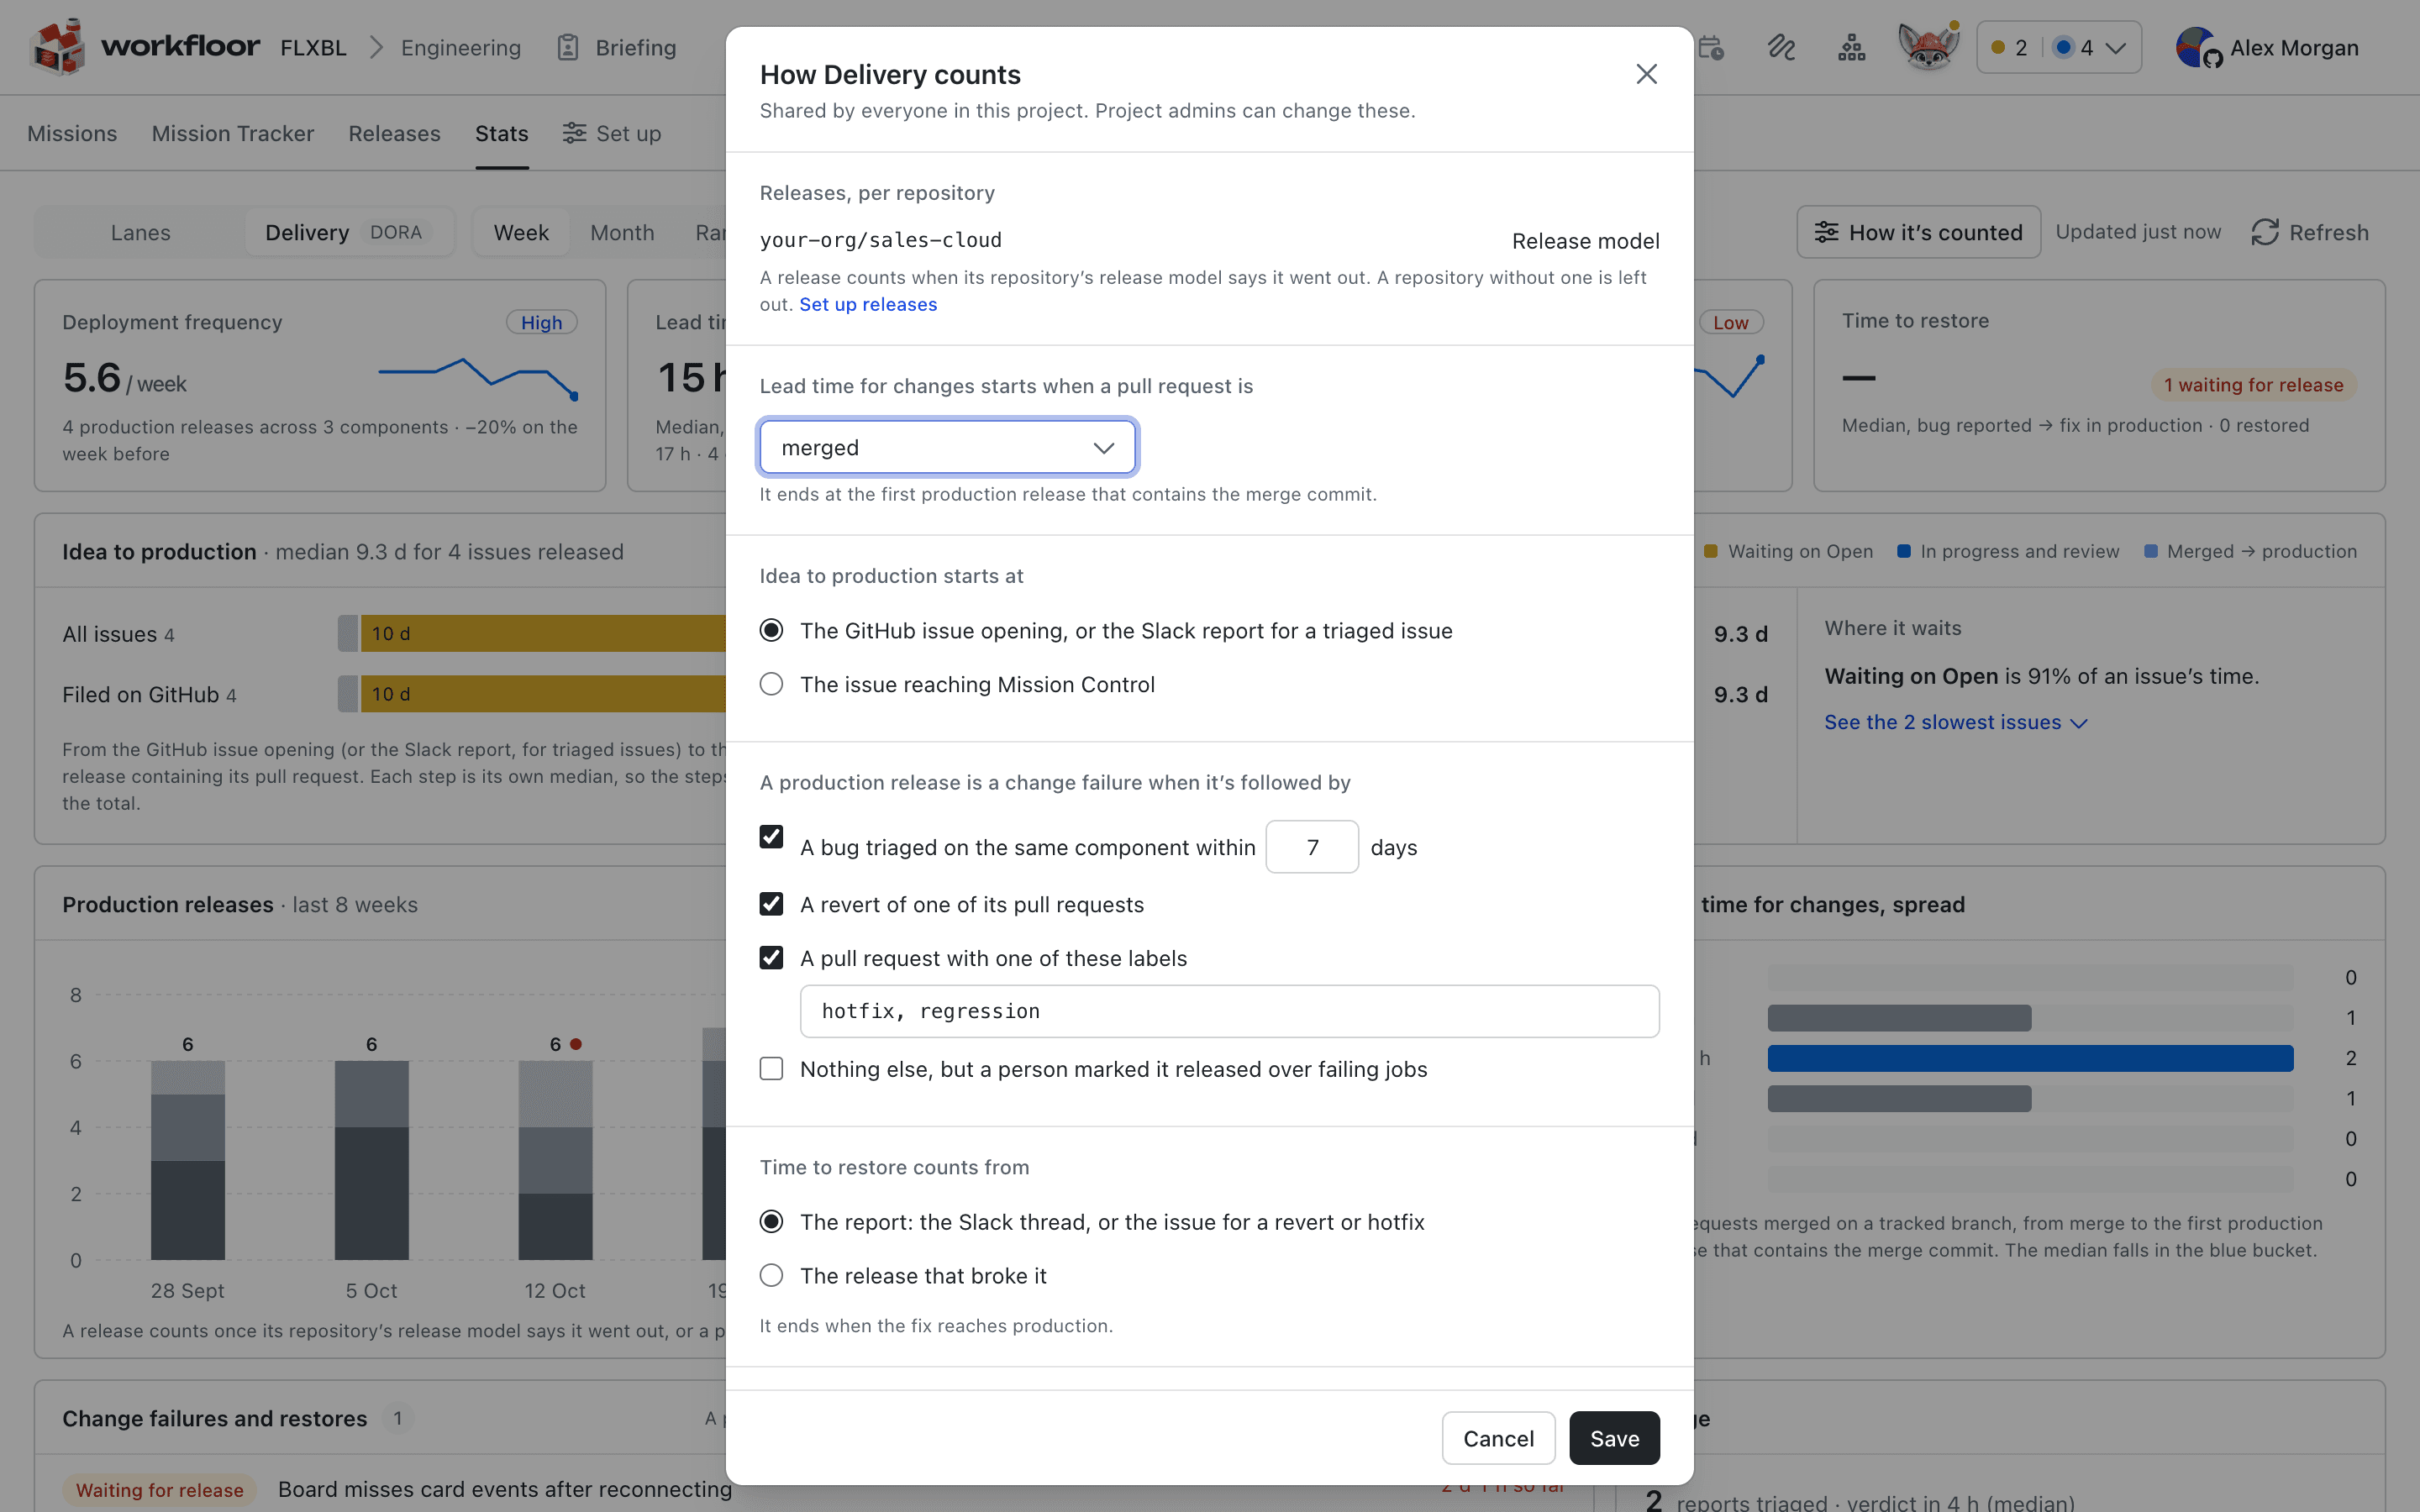
| Setting | Choices | Default |
|---|---|---|
| Lead time for changes starts when a pull request is | merged, or opened | merged |
| Idea to production starts at | the GitHub issue opening (or the Slack report for a triaged issue), or the issue reaching Mission Control | the issue opening |
| A production release is a change failure when it's followed by | a bug triaged on the same component within a number of days; a revert of one of its pull requests; a pull request with one of a list of labels; a person marking it released over failing jobs | a triaged bug within 7 days, a revert, or the labels hotfix and regression |
| Time to restore counts from | the report (the Slack thread, or the issue for a revert or hotfix), or the release that broke it | the report |
Mission Control times each move between its columns when it next syncs with GitHub, so an issue's steps can read a few minutes late.
Next: Support triage.
Delivery records
The delivery record Workfloor keeps for every card, measuring quality, people's interventions, delivery time and cost, and how a Salesforce team traces a regression back to the card that caused it.
Support triage
How Workfloor turns support messages in a Slack channel into triage cards, where Flux investigates a Salesforce issue and answers in the thread, and how you open the drafted GitHub issue.