Measuring delivery
How Workfloor measures a Salesforce team's delivery from its own records, with lane stats, a delivery record for every card and the four DORA metrics in Mission Control's Stats.
Workfloor measures how work is delivered. It takes the measures from what it already records about each card, each pull request and each release. Nobody fills in a timesheet or a survey. You read them in Mission Control > Stats.
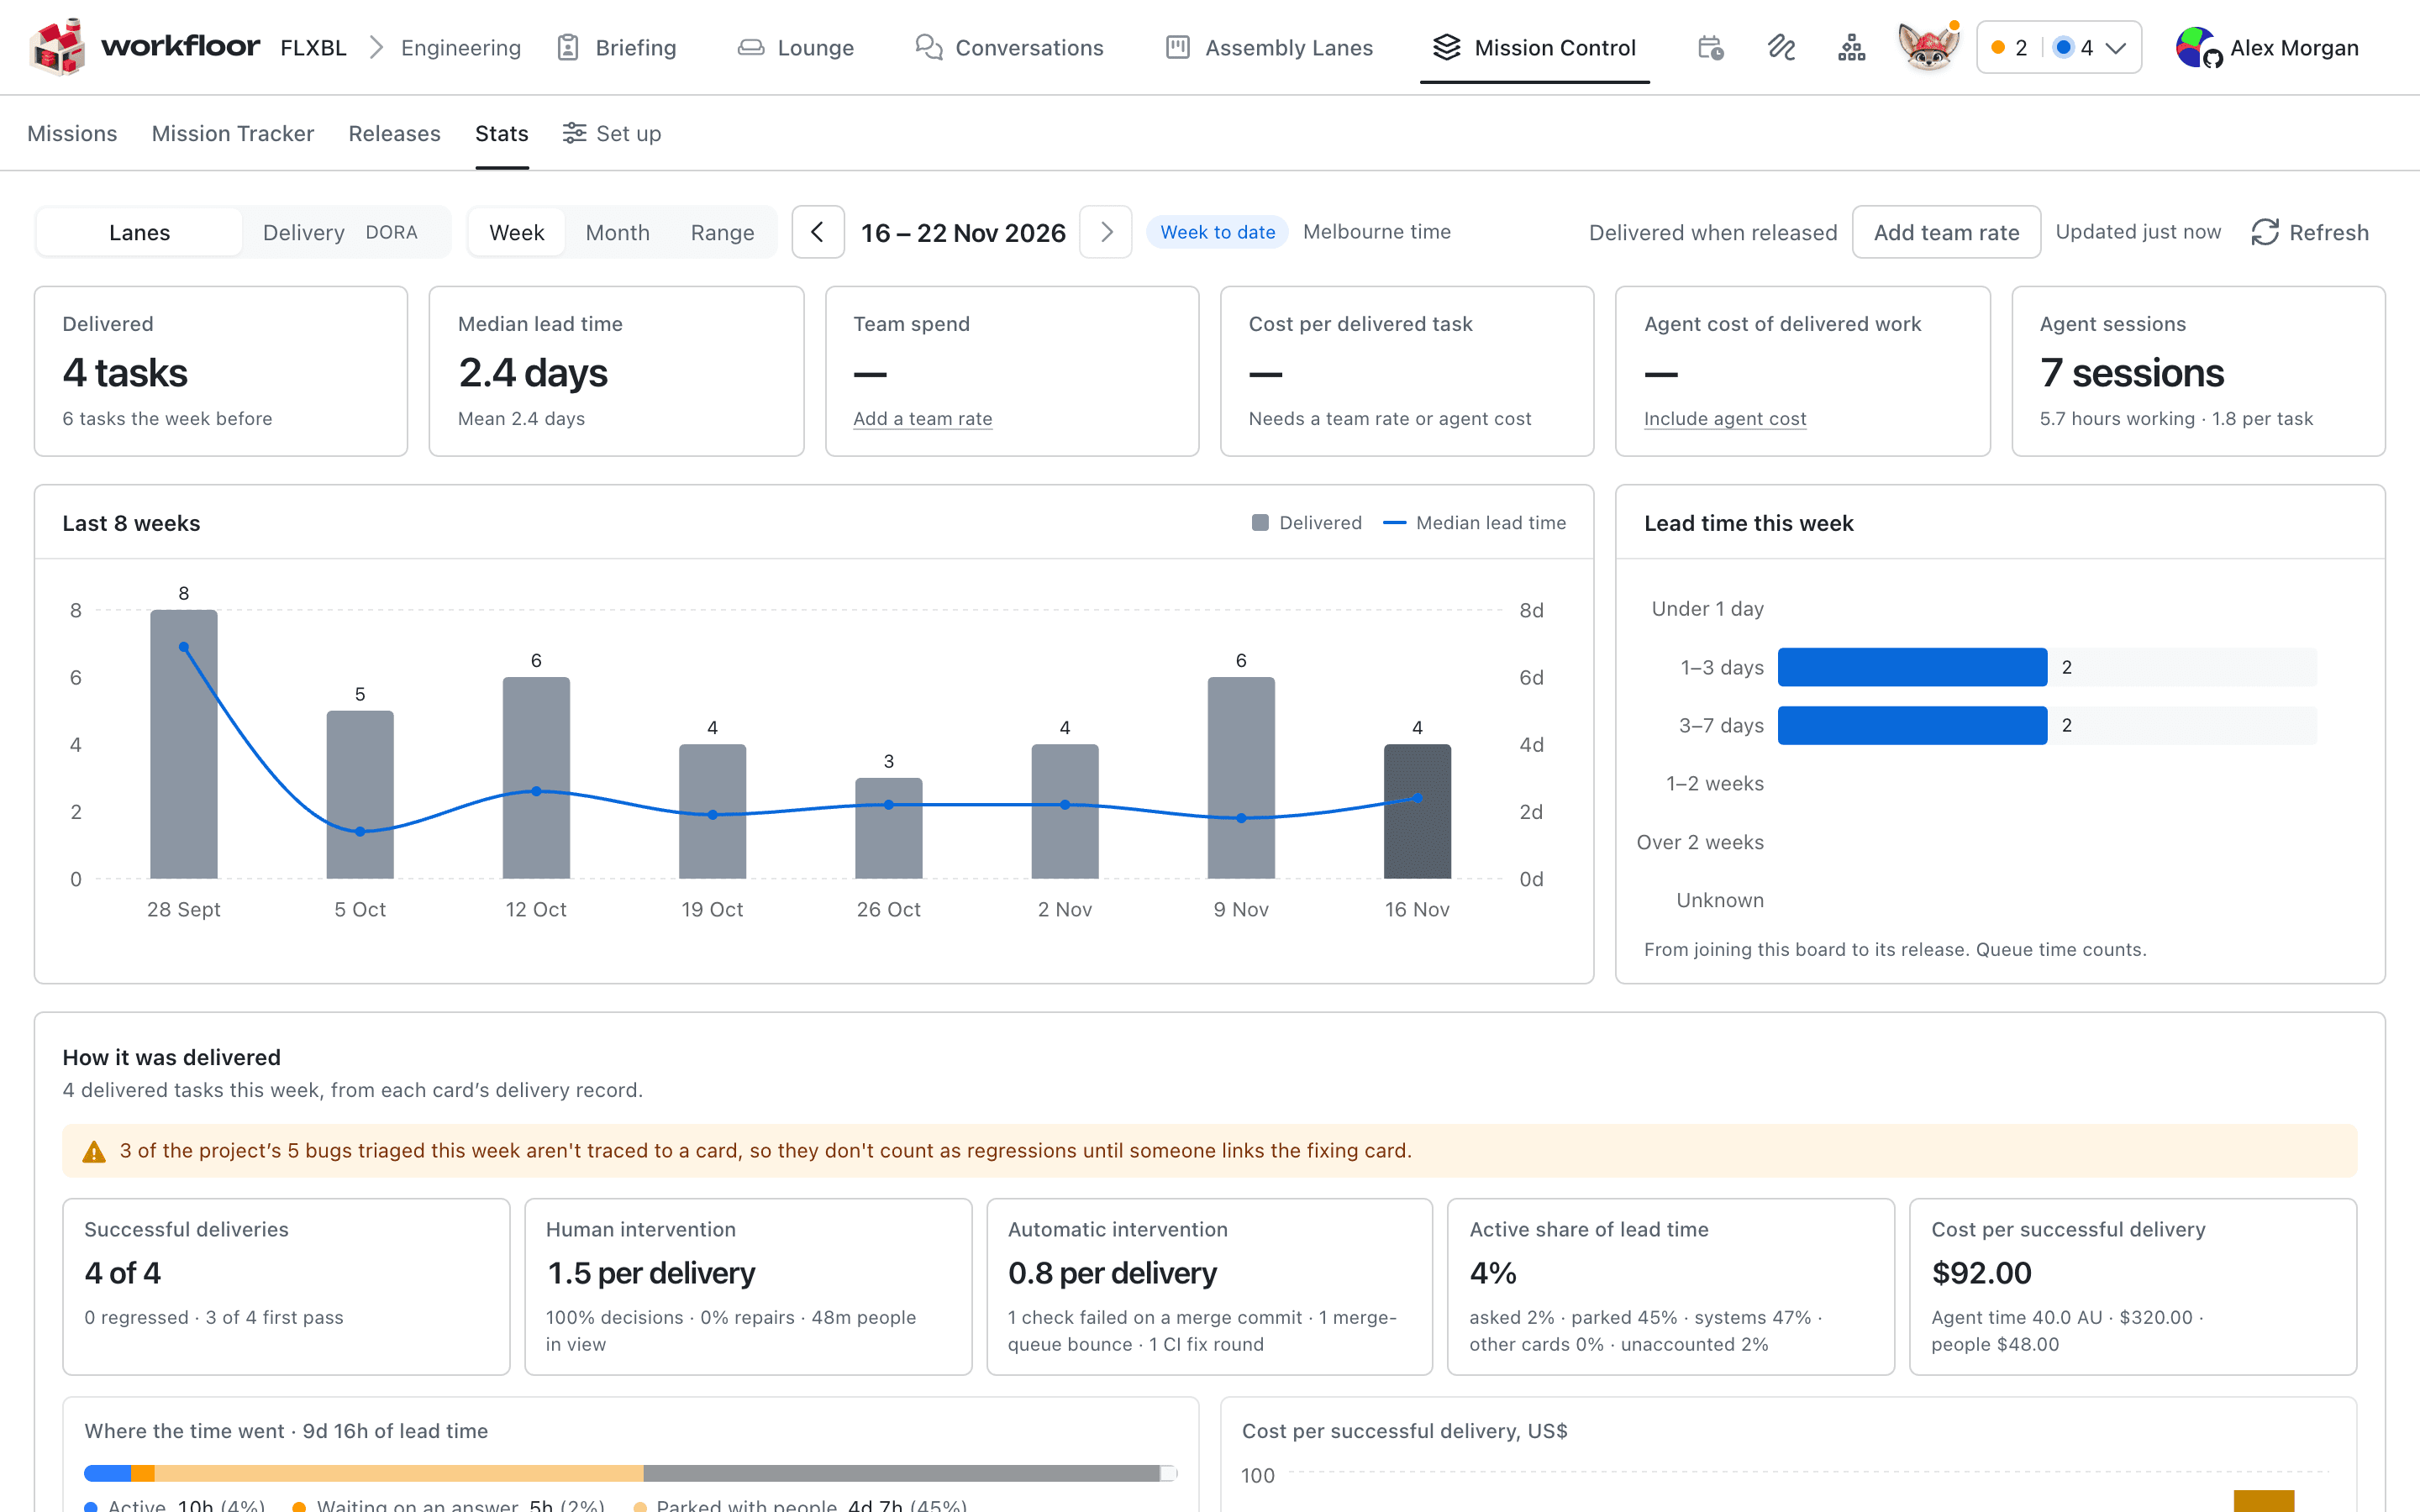
What Workfloor counts
Agents make work cheap to start. The useful questions are whether the work reached production, whether it held there, how much of a person's attention it took and what it cost. Workfloor answers these at three levels:
- A card keeps a delivery record with four measures: quality, people's interventions, delivery time and cost.
- A lane adds up its cards' records for a week, a month or a range of days. See Lane stats.
- A project gets the four DORA metrics for its repositories, from production releases.
The headline figure is cost per successful delivery. It is the cost of everything a lane delivered or abandoned in a period, divided by the deliveries that didn't regress. Work that was thrown away or had to be fixed later still counts in the cost.
When work counts as delivered
A card is delivered when its pull requests reach production. Workfloor reads this from Mission Control's Released column, which follows each repository's release model. A merged pull request that is waiting for its release is still in progress, whatever stage its card is in.
Where a repository has no confirmed release model, a pull request counts as delivered when it merges. A card with no pull request is delivered when it reaches its lane's done stage.
The two views
Stats has two views. Select one at the top left.
| View | What it shows |
|---|---|
| Lanes | One lane's delivered cards, lead time, cost and agents, with how each card was delivered |
| Delivery | The project's DORA metrics, the way from an idea to production, change failures and production releases |
Next to the views, choose the period: Week, Month or Range. Use the arrows to step back through earlier periods. A week runs from Monday to Sunday in the time zone the lane's report settings name. A period that hasn't ended yet says so, for example Week to date.
Who sees and changes what
Every member of the project can read Stats. Project admins change the settings:
- a lane's report settings: its time zone, team rate and person-hour rate;
- the project's How Delivery counts: which events count as a change failure, and where lead time and time to restore start.
Only project admins see a lane's team rate and person-hour rate. Everyone else sees only whether they are set.
In this section
- Lane stats — a lane's deliveries, lead time and costs, where the time went, and its report settings.
- A card's delivery record — the four measures Workfloor keeps for each card, and how a regression is traced.
- DORA metrics — deployment frequency, lead time for changes, change failure rate and time to restore, worked out from your releases.
Next: Lane stats.
The release board
Read the Workfloor release board in Mission Control, promote or approve a release into the next lane, and see what released means on cards and missions.
Lane stats
Read a Workfloor lane's delivery stats for a Salesforce team, with tasks delivered, lead time, cost per successful delivery, where the time went, the agents' work and the lane's report settings.