Change analysis
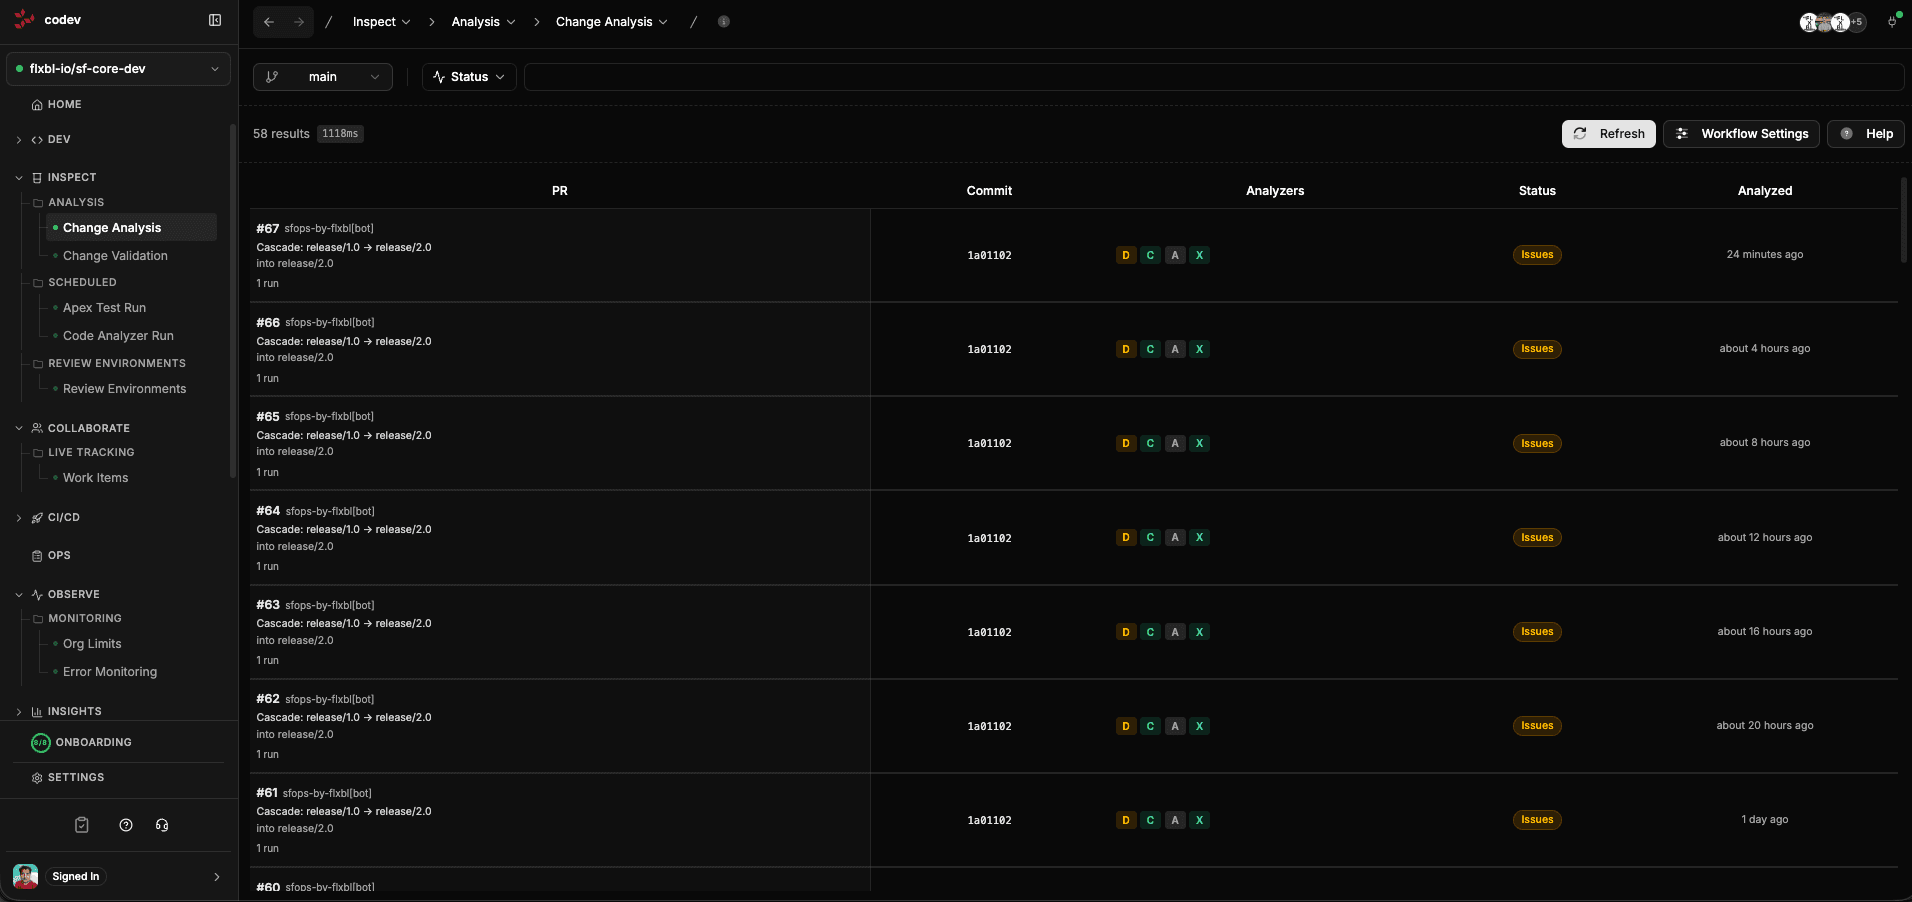
Change Analysis automatically reviews every pull request for code quality issues before it is merged. It runs four linters against the PR diff — not the entire repository — so results are focused on what actually changed.
What gets checked
Each PR is analyzed by four linters. Results appear as colored badges on each PR row — green for pass, orange for warnings, red for failures.
Duplicates
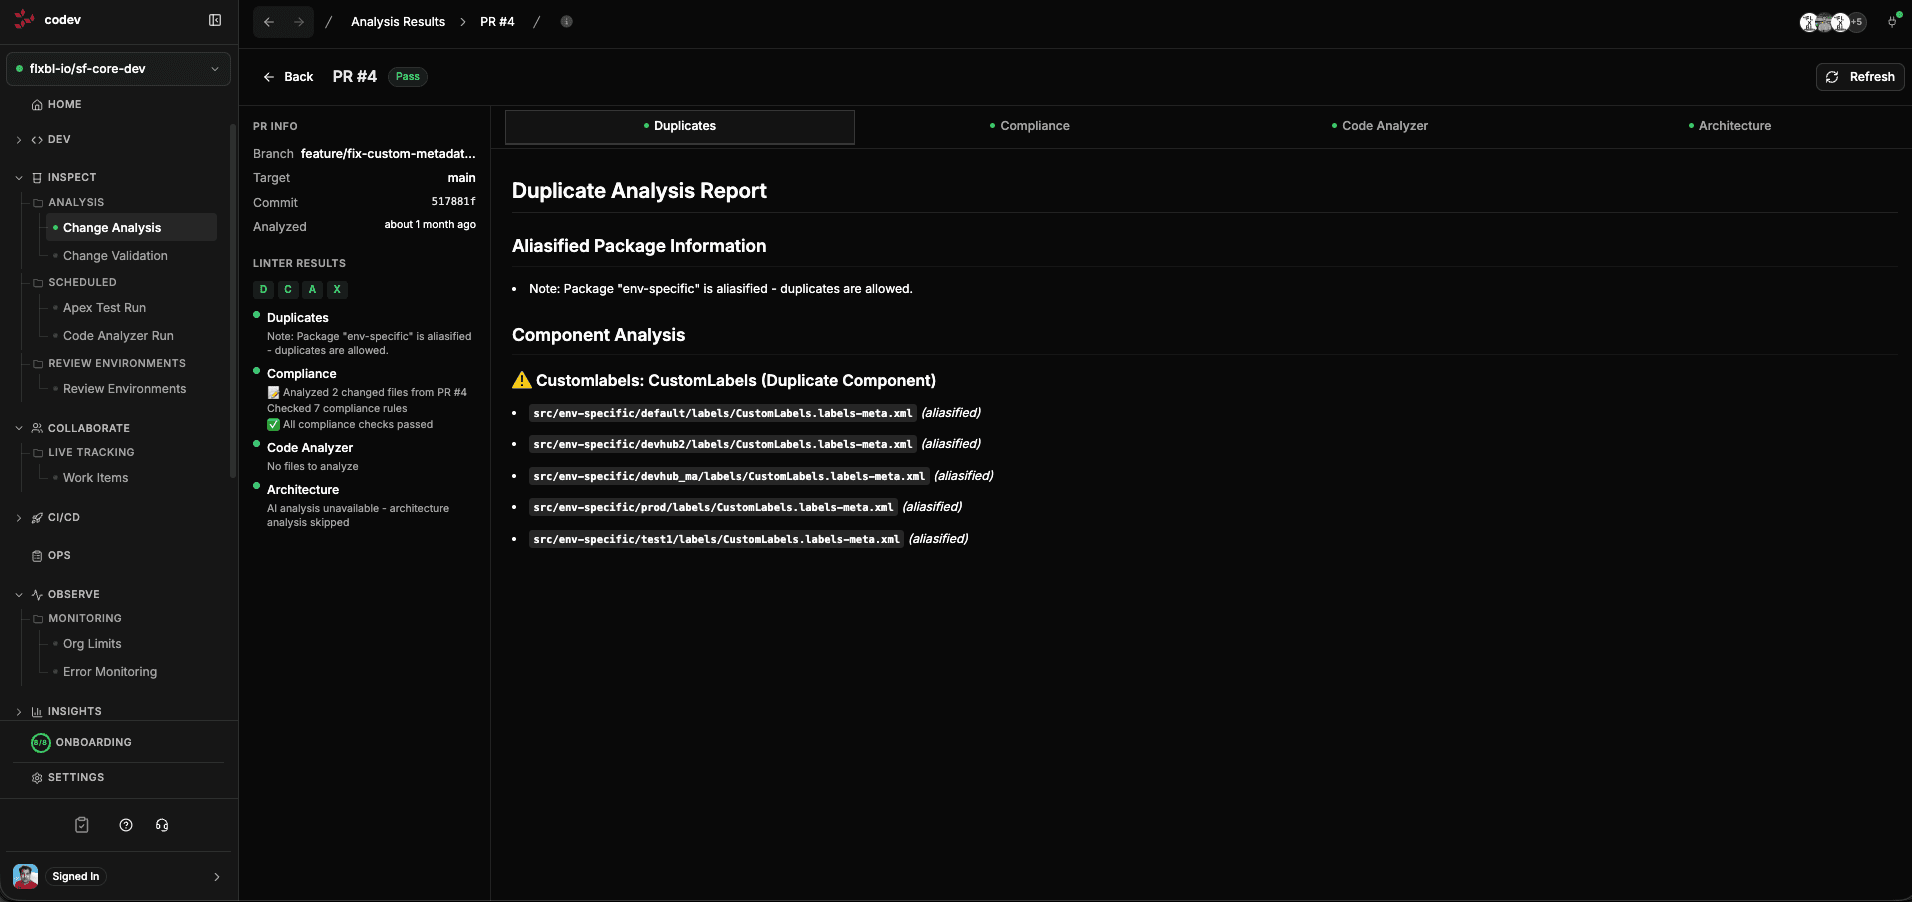
Detects duplicate metadata components across your packages. For example, if the same CustomLabel appears in multiple packages, the Duplicates linter flags it with the exact file paths. This prevents conflicts during deployment where one package's version of a component overwrites another.
Compliance
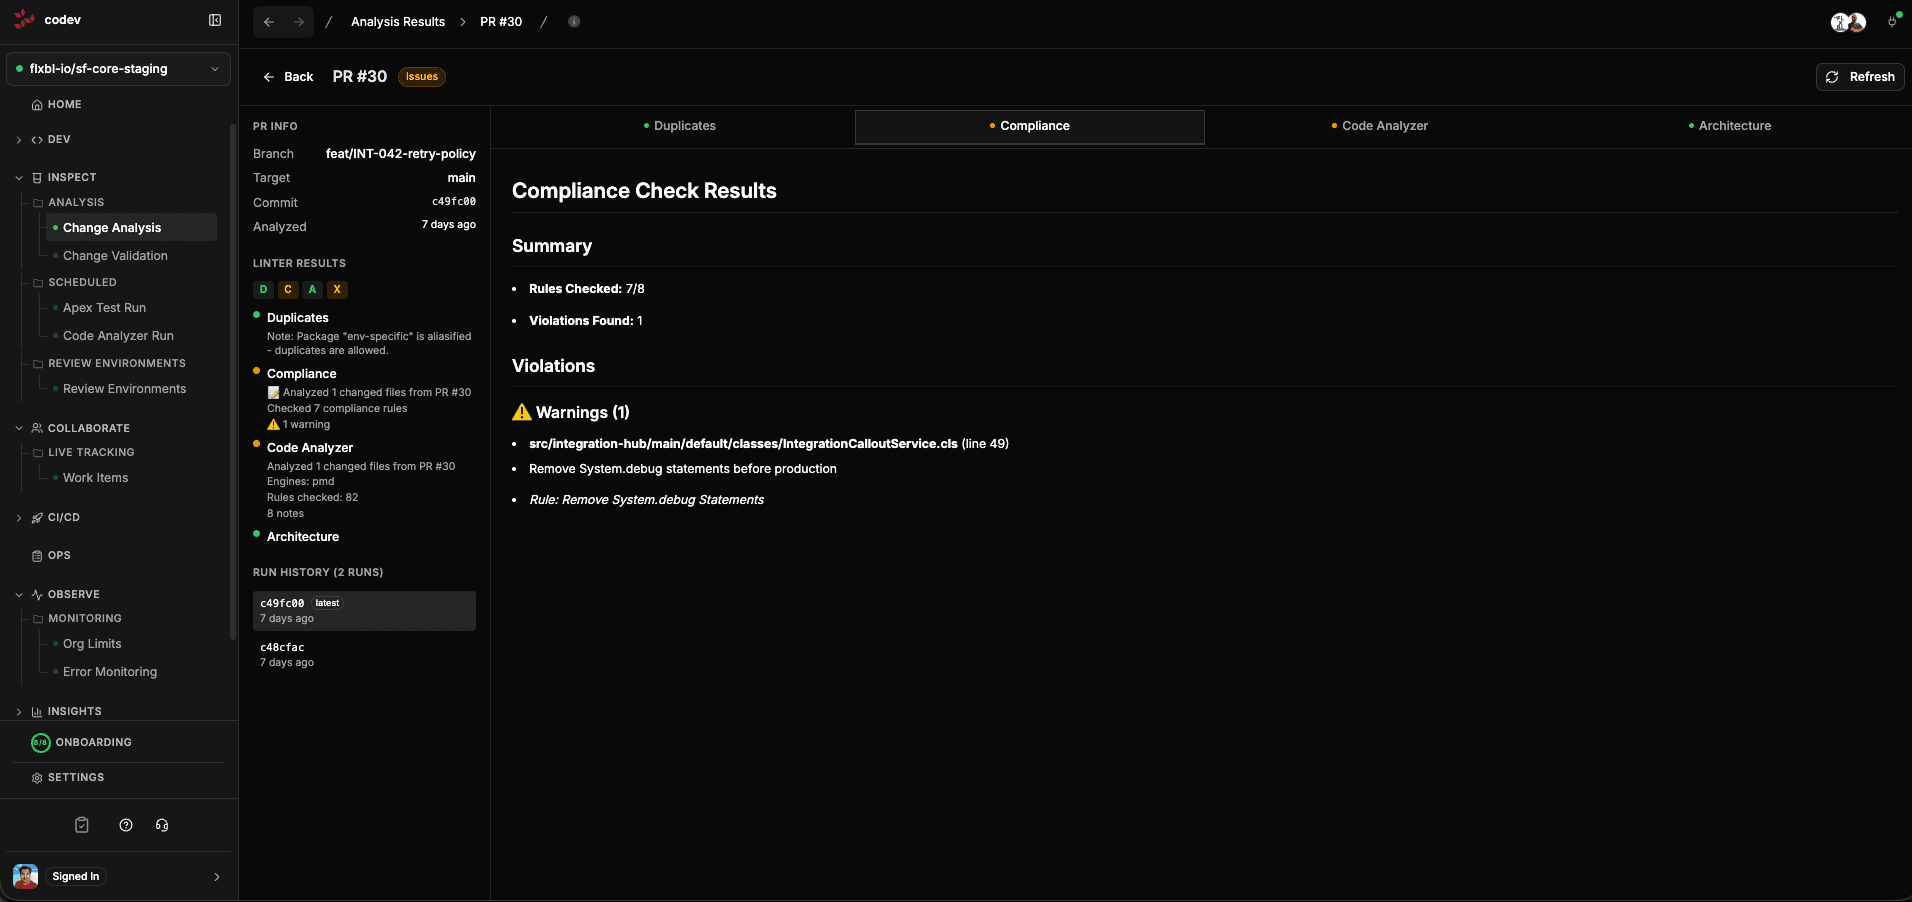
Checks your changes against a set of compliance rules. The report shows how many rules were checked, how many violations were found, and the specific warnings with file locations and rule descriptions. For example, flagging System.debug statements that should be removed before production.
Code Analyzer
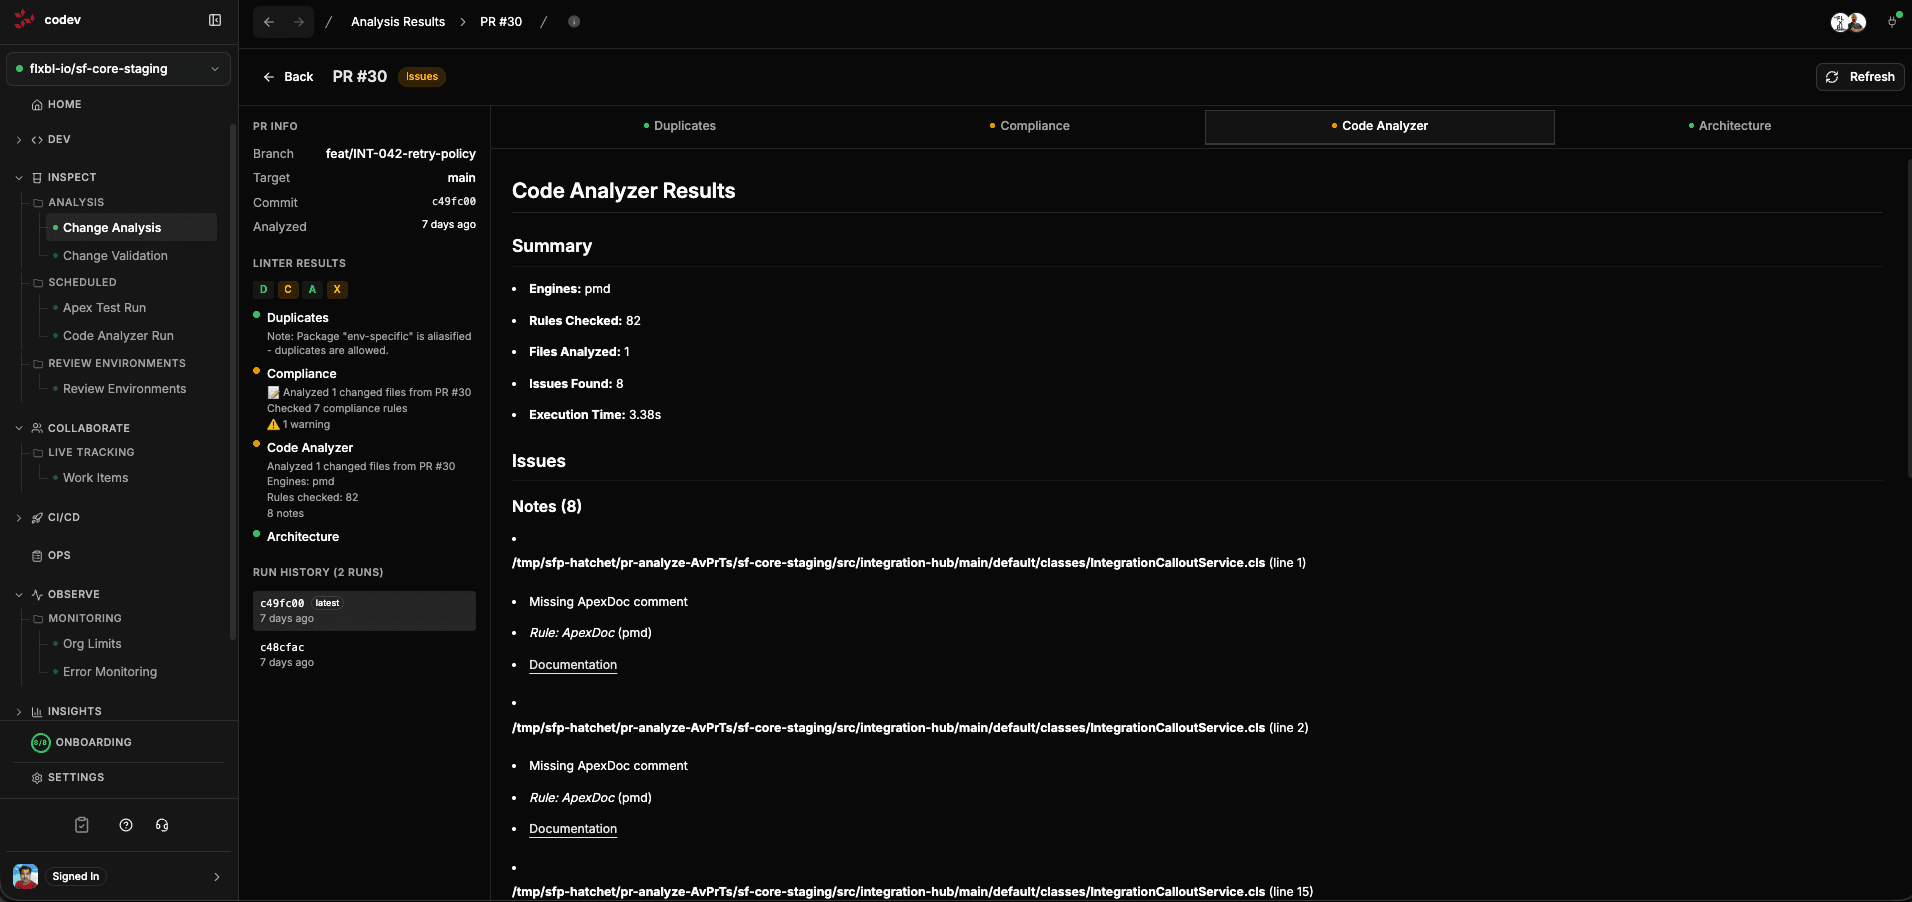
Runs Salesforce Code Analyzer (PMD and other engines) against the changed files. Results are presented in SARIF format with the engine used, rules checked, files analyzed, execution time, and specific issues with file locations and line numbers.
Architecture
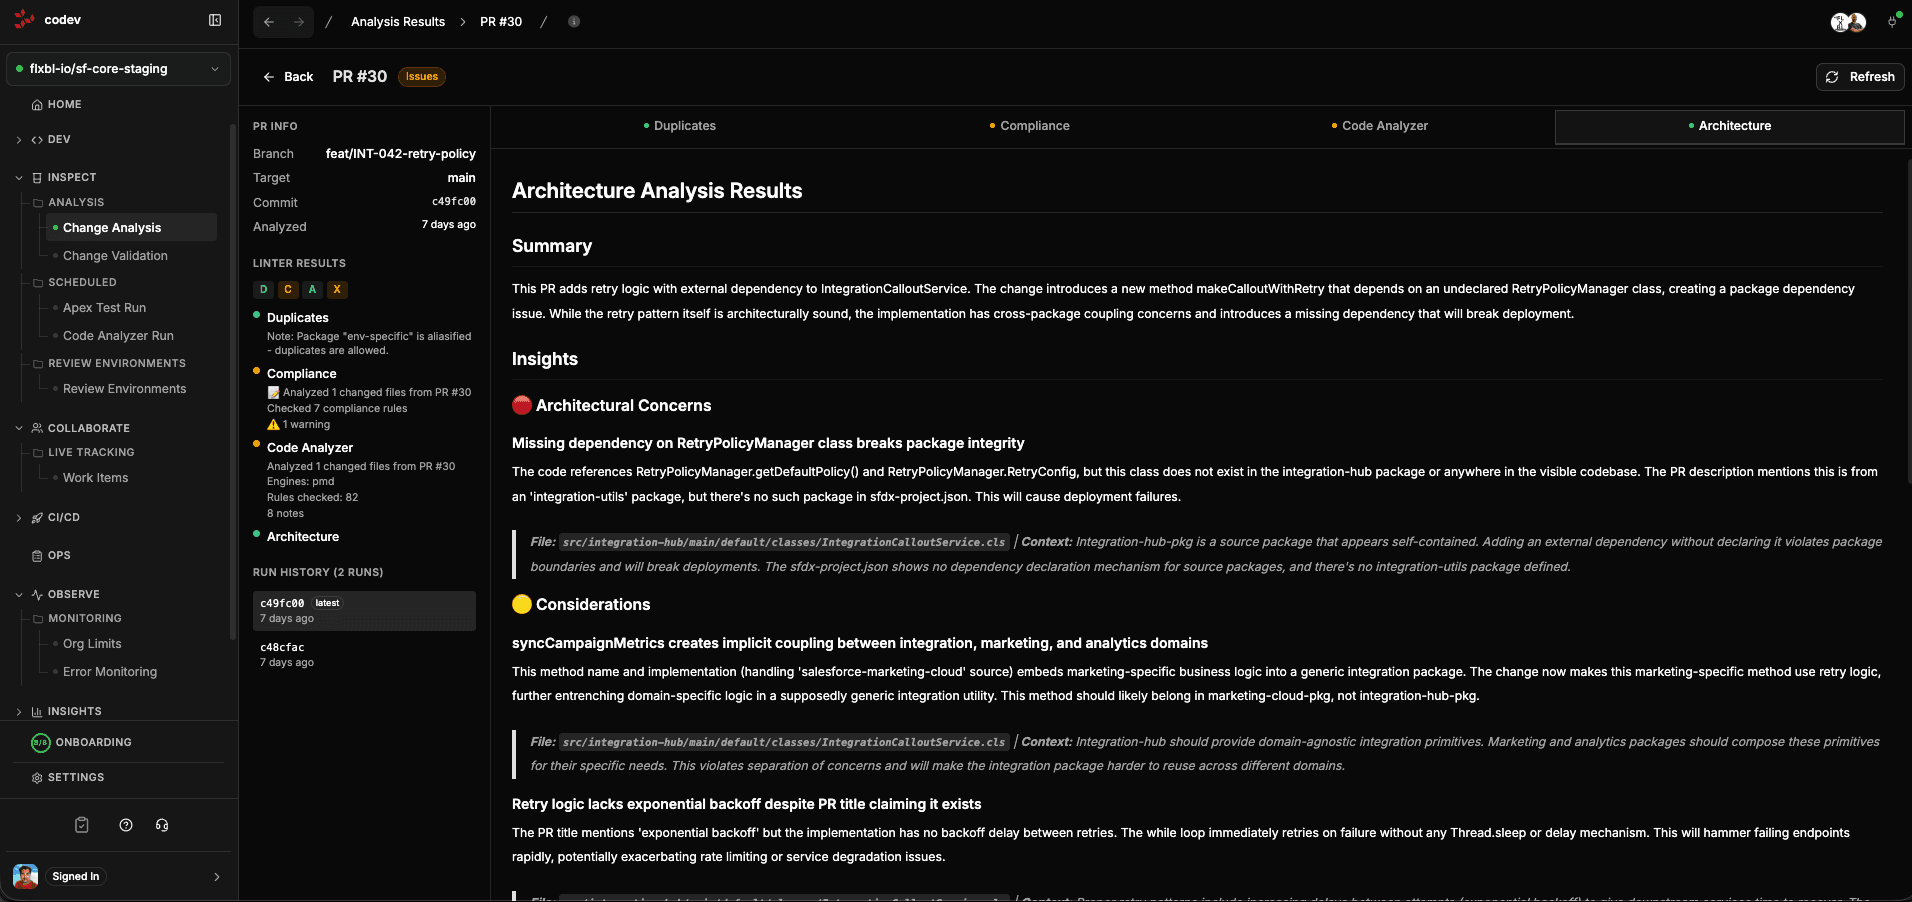
AI-powered analysis that evaluates the architectural impact of your changes. It identifies concerns like implicit coupling between packages, dependency violations, backwards compatibility risks, and design issues. Each insight includes the specific files involved and an explanation of why it matters.
How it works
Change Analysis is triggered automatically when a PR is opened or updated. codev's workflow engine:
- Clones the repository at the merge ref
- Computes the diff between the PR and the base branch
- Runs each linter against only the changed files
- Publishes results to the server and creates a check run on the PR in GitHub or Azure DevOps
The whole process typically completes in under a minute.
Configuring analysis
Click Workflow Settings on the Change Analysis page to control how each PR is analyzed. The dialog holds the analysis workflow toggle, the codev Package Version Assessment toggle, and a set of per-branch rules. A rule matches a target branch by pattern — main, release/* — and carries two toggles per linter: Enabled runs the linter, Fail On makes its findings fail the PR check.
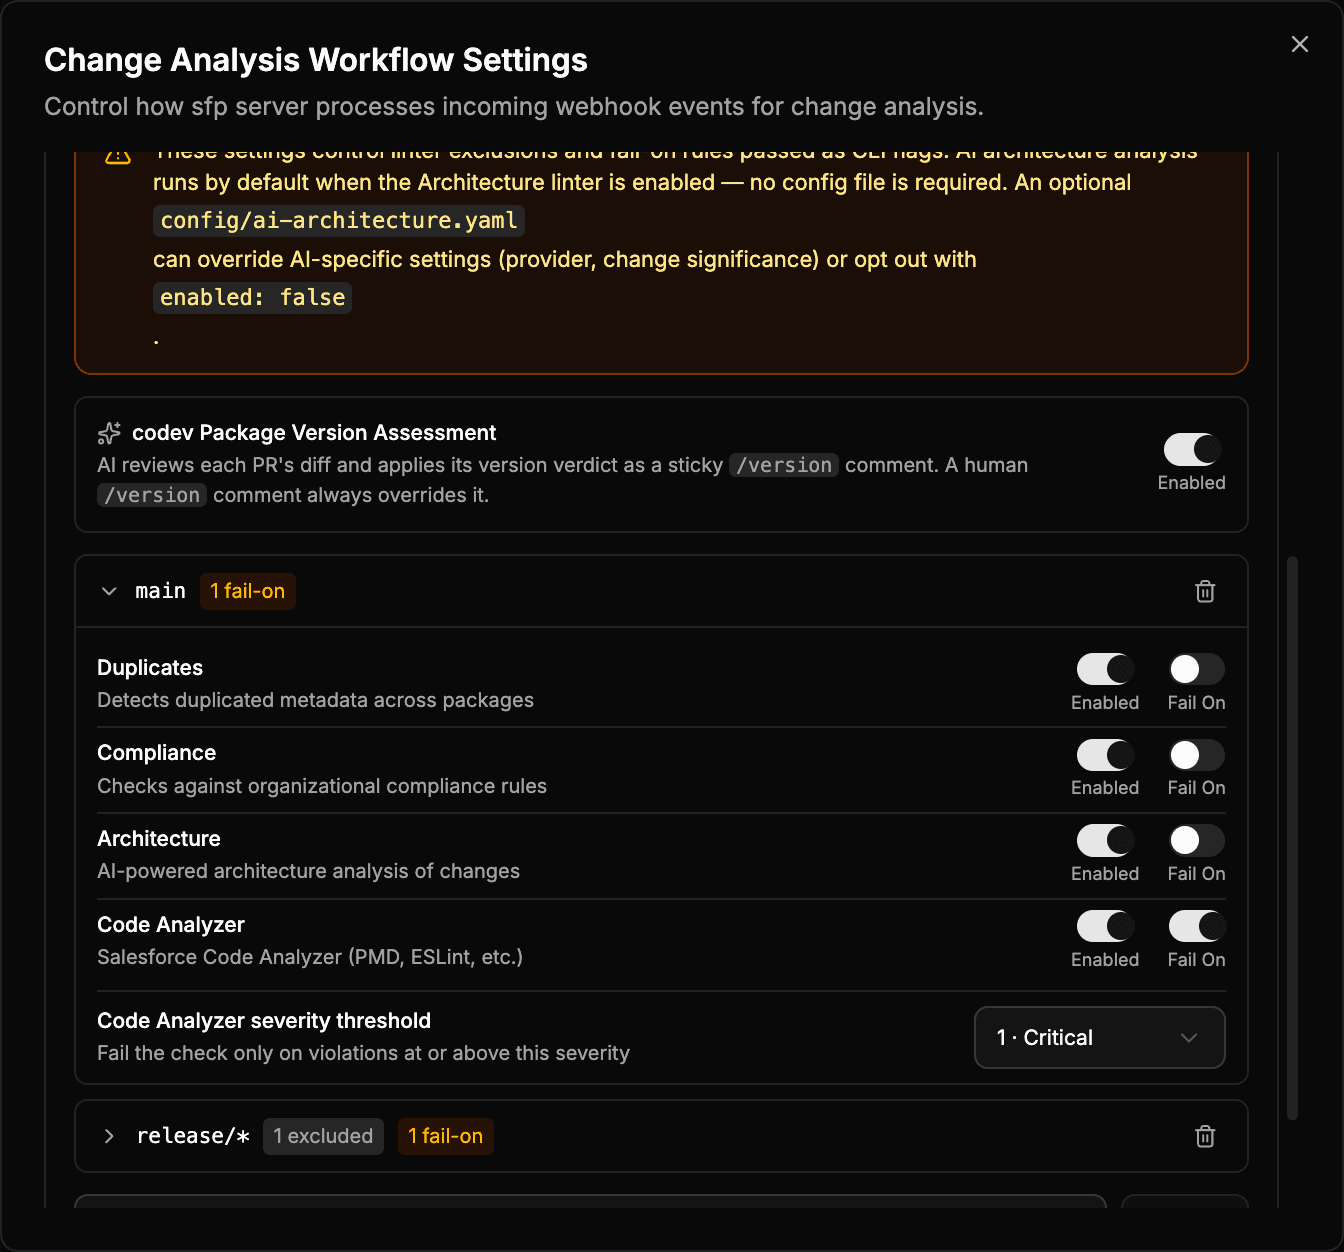
Code Analyzer severity threshold
When Code Analyzer is set to Fail On for a rule, a Code Analyzer severity threshold control appears. It fails the check only on violations at or above the chosen severity; lower-severity findings are still reported. Severity runs from most to least severe:
| Value | Severity |
|---|---|
1 | Critical |
2 | High |
3 | Moderate |
4 | Low |
5 | Info |
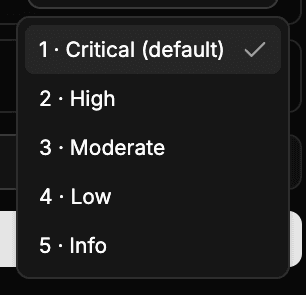
The control pre-fills Critical for a new rule, and a badge on the rule header marks any rule set to a more lenient level. Settings saved here are written to the server-side analyze configuration and apply to PR validation. The same threshold is available on the command line — see Failing on severity.
The linters and fail-on rules can also be configured by adding configuration files to your repository under the config/ directory.
Configuration files
All configuration files live in your repository root under config/. If a file is absent, the linter falls back to safe defaults.
| File | Purpose |
|---|---|
config/analyze.yaml | Orchestration: which linters run, what causes failure |
config/compliance-rules.yaml | Rules for the compliance linter |
config/code-analyzer.yml | Config for Salesforce Code Analyzer (PMD/ESLint/CPD) |
config/ai-assist.yaml | Config for the AI architecture linter |
config/duplicates.yaml | Exclusion config for the duplicates linter |
Orchestration — config/analyze.yaml
This file controls which linters run and which ones cause a PR check to fail. It supports per-branch overrides, so you can enforce stricter rules on release branches while keeping feature branches lenient.
# config/analyze.yaml
excludeLinters:
  - architecture

failOn:
  - compliance
  - code-analyzer

branchRules:
  - pattern: "release/*"
    failOn:
      - compliance
      - code-analyzer
      - duplicates
    codeAnalyzerSeverityThreshold: 2   # fail only on High and above
  - pattern: "main"
    failOn:
      - compliance
      - code-analyzer
    codeAnalyzerSeverityThreshold: 1   # fail only on Critical
codeAnalyzerSeverityThreshold is the same 1–5 scale as the Workflow Settings control (1 Critical … 5 Info); it fails the check only on Code Analyzer violations at or above that severity. It is the config-file equivalent of the UI control above — the value set in Workflow Settings is written to the server-side config, and a value here overrides that for the matching branch.
When changeSignificanceEnabled is set to true, the architecture linter skips PRs whose diffs are below the significance thresholds defined in ai-assist.yaml. This saves AI API costs for trivial changes.
Config priority
The analyzer resolves its orchestration config in this order:
- CLI flags — highest priority
config/analyze.yaml— local file in the repo- Server project config — fallback when no local file exists (configured in codev under project settings)
- Defaults — all linters enabled, none fail the check
For detailed configuration of each linter, see the sfp documentation:
Viewing results
The Change Analysis list shows one row per analysis run with a status pill (Pass, Issues, or Failed) and per-linter badges. Filter by branch, status, or PR number, search by commit or branch, and toggle Latest run only to collapse older runs of the same PR.
Click any PR row to see the full analysis detail. The left sidebar shows PR info (branch, target, commit) and linter result badges. The main content area shows each linter's findings as an expandable tree — expand a linter to read its individual notes, or use the expand-all control to open everything at once.
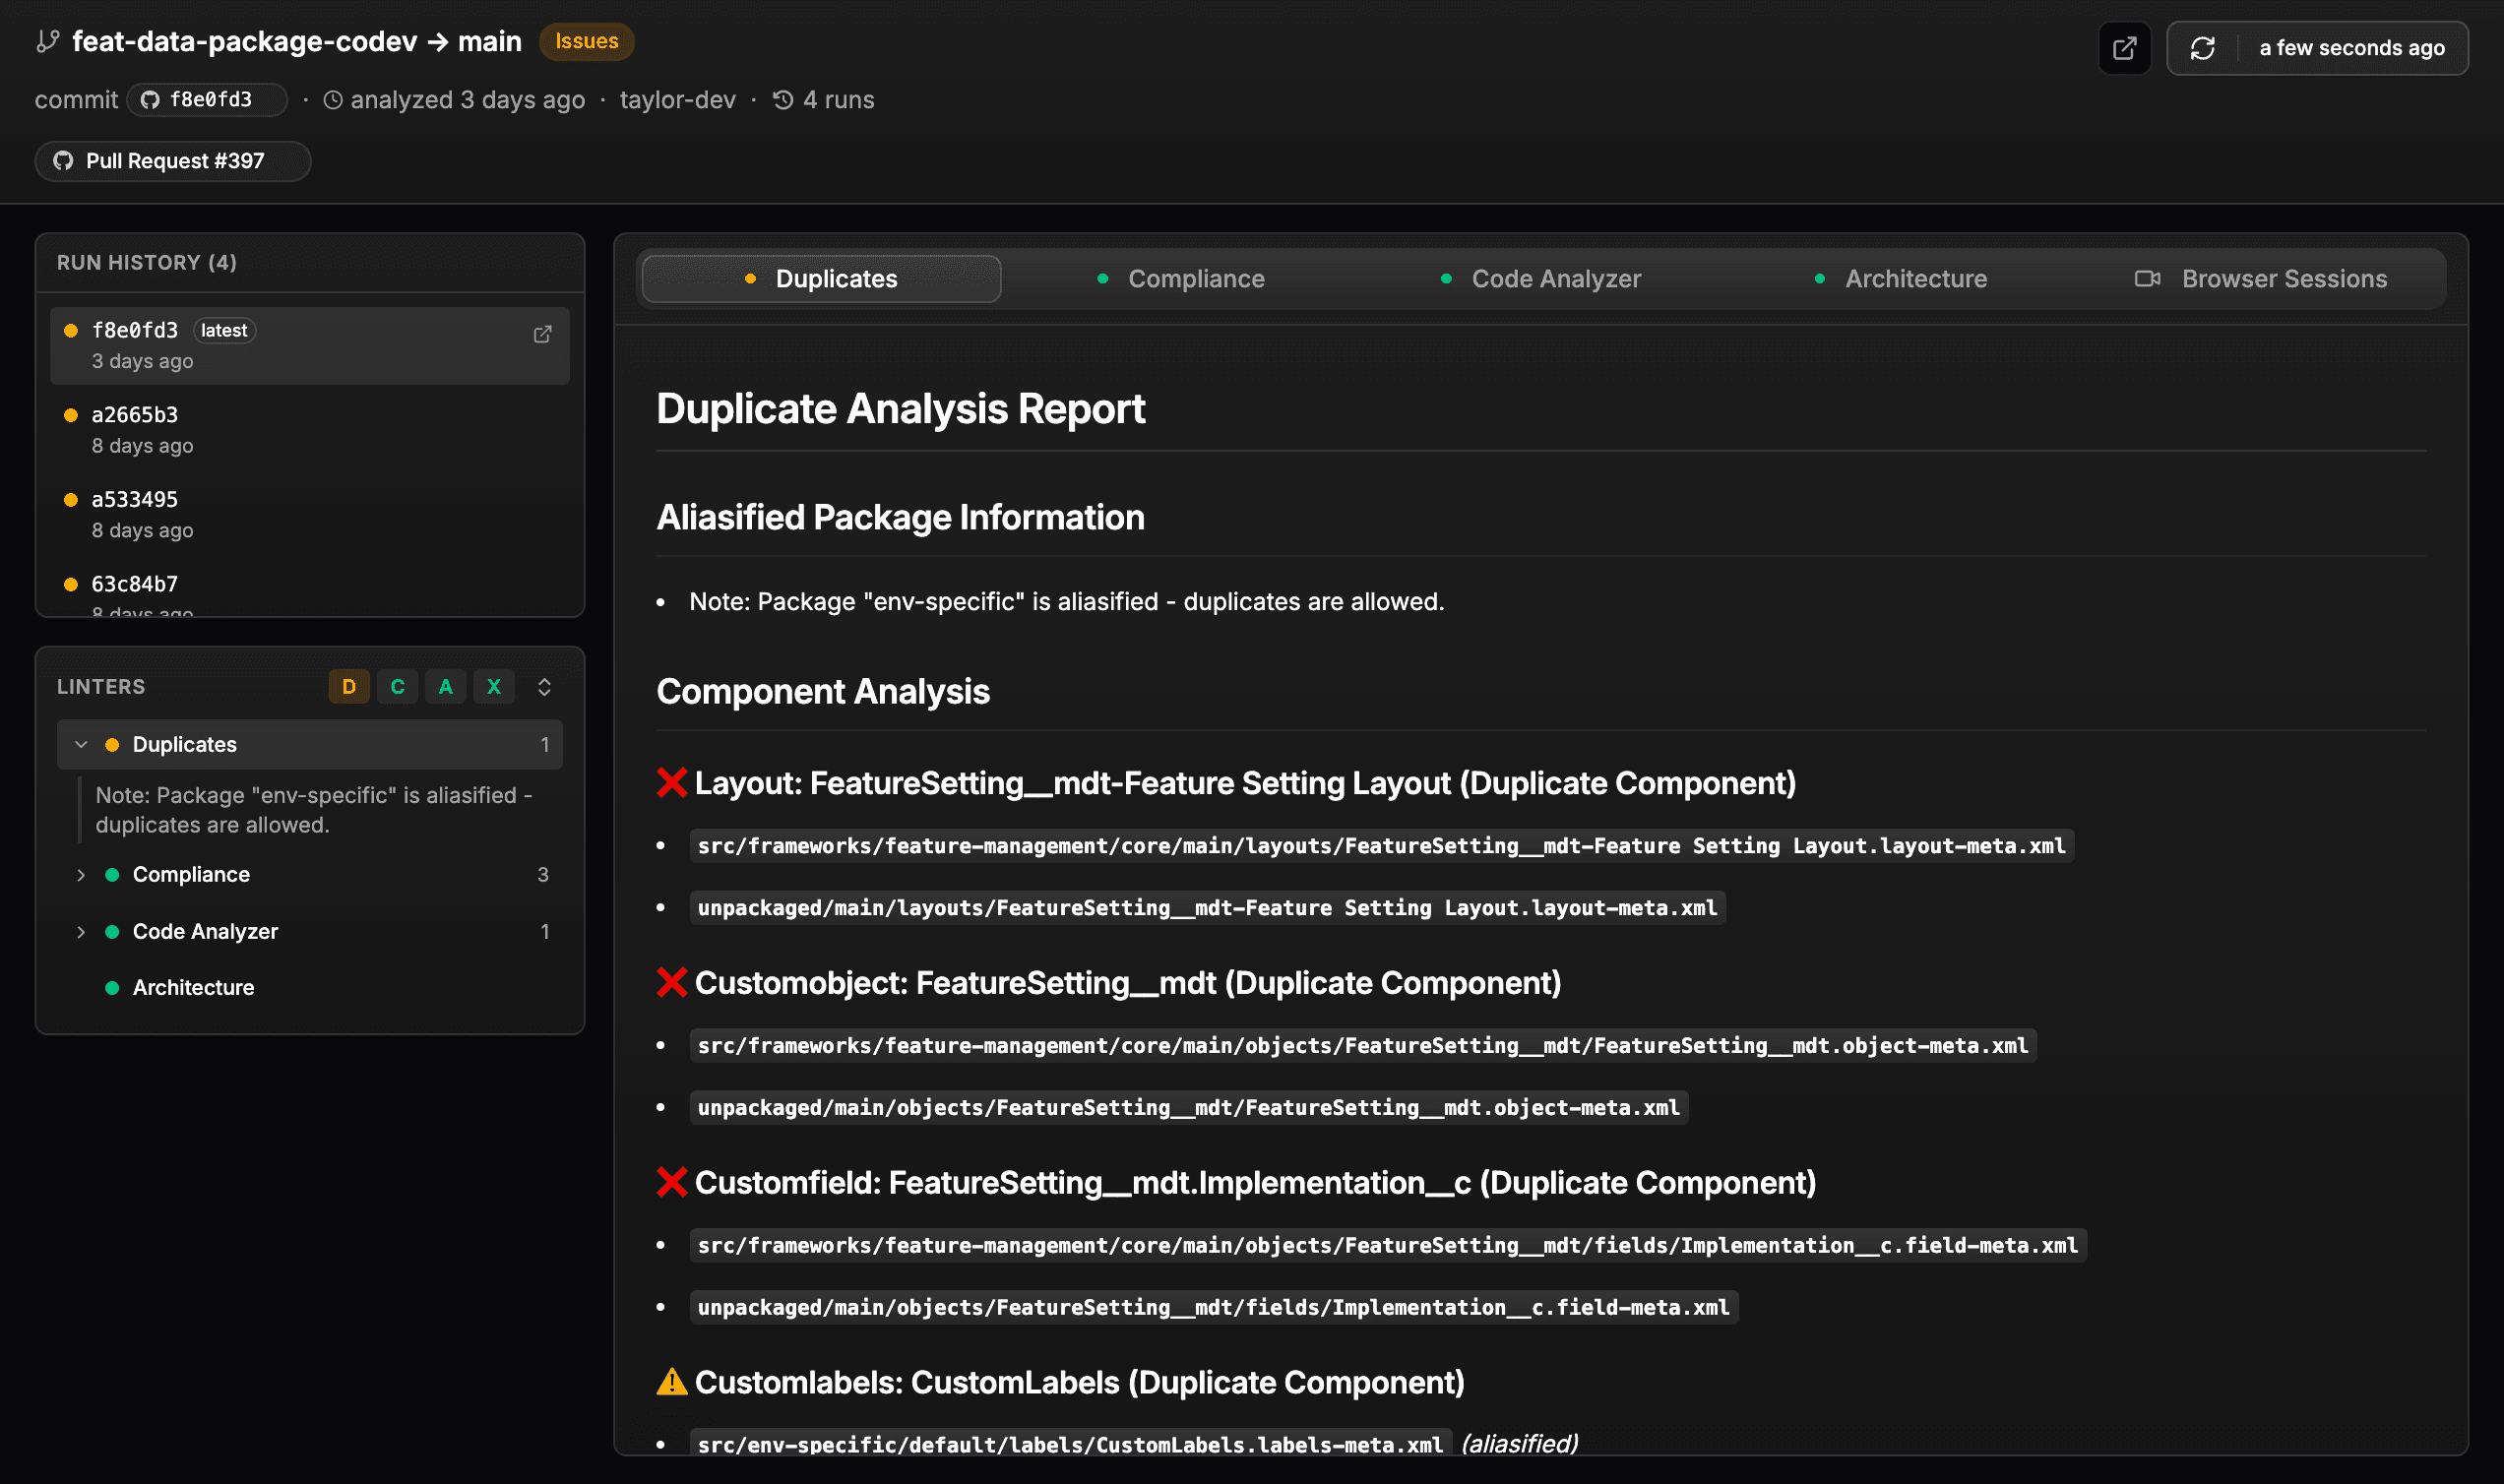
Each result links to its workflow run, so you can open the underlying execution and its logs when a linter fails unexpectedly. The Run History section at the bottom of the sidebar shows previous analysis runs for the same PR, so you can see if issues were introduced or fixed across commits.
Next steps
Change Analysis reviews the code in a PR; Change Validation deploys it to a review environment to prove it installs. Scheduled runs apply the same linters to whole branches on a schedule.